Puget Sound Salish vs Thai 1st Grade
COMPARE
Puget Sound Salish
Thai
1st Grade
1st Grade Comparison
Puget Sound Salish
Thais
98.2%
1ST GRADE
98.2/ 100
METRIC RATING
99th/ 347
METRIC RANK
98.1%
1ST GRADE
94.7/ 100
METRIC RATING
119th/ 347
METRIC RANK
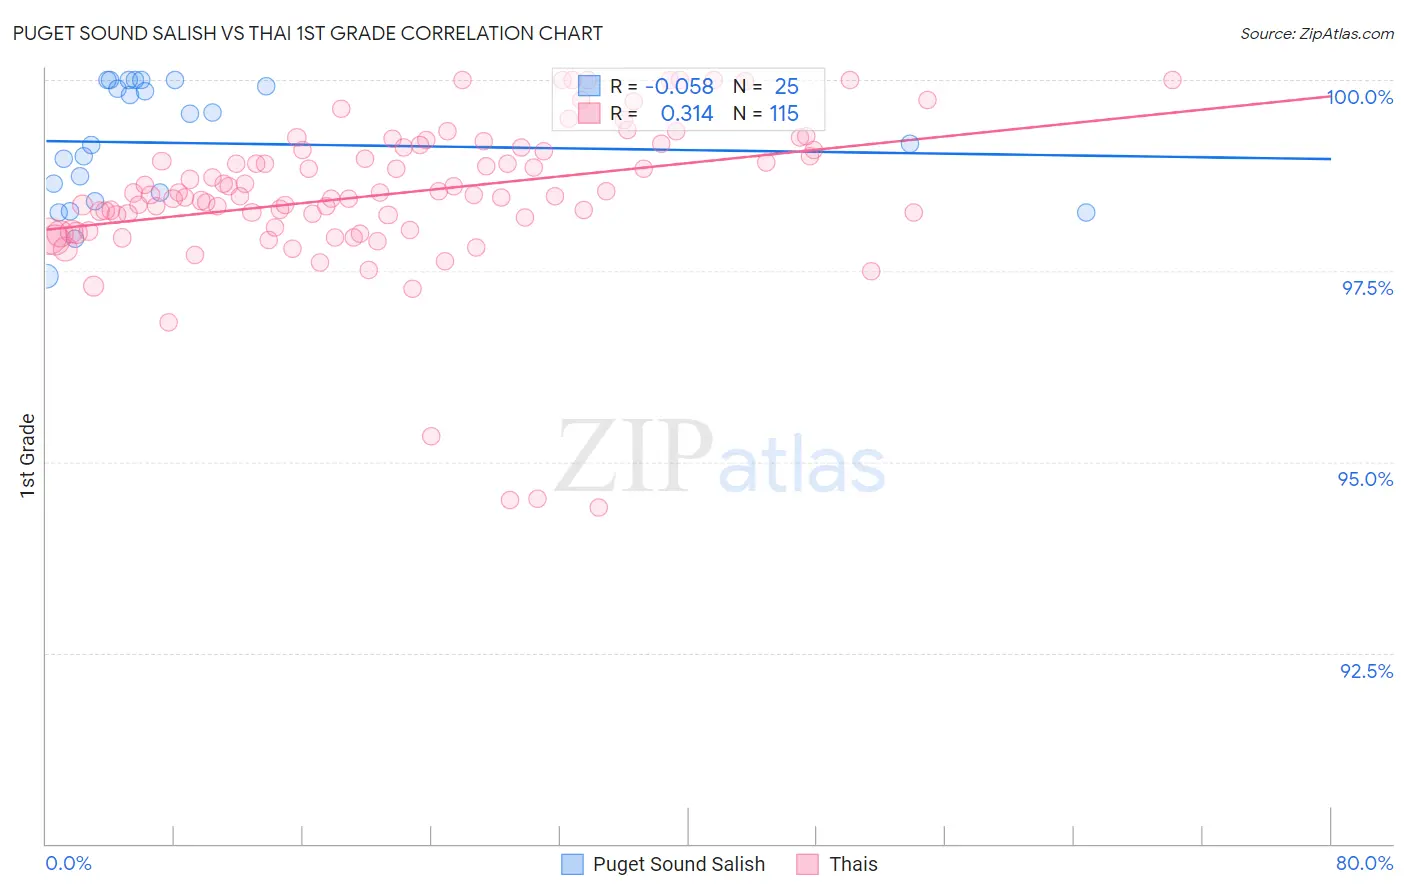
Puget Sound Salish vs Thai 1st Grade Correlation Chart
The statistical analysis conducted on geographies consisting of 46,155,746 people shows a slight negative correlation between the proportion of Puget Sound Salish and percentage of population with at least 1st grade education in the United States with a correlation coefficient (R) of -0.058 and weighted average of 98.2%. Similarly, the statistical analysis conducted on geographies consisting of 475,866,115 people shows a mild positive correlation between the proportion of Thais and percentage of population with at least 1st grade education in the United States with a correlation coefficient (R) of 0.314 and weighted average of 98.1%, a difference of 0.090%.
1st Grade Correlation Summary
| Measurement | Puget Sound Salish | Thai |
| Minimum | 97.4% | 94.4% |
| Maximum | 100.0% | 100.0% |
| Range | 2.6% | 5.6% |
| Mean | 99.2% | 98.5% |
| Median | 99.2% | 98.5% |
| Interquartile 25% (IQ1) | 98.5% | 98.1% |
| Interquartile 75% (IQ3) | 100.0% | 99.1% |
| Interquartile Range (IQR) | 1.5% | 1.0% |
| Standard Deviation (Sample) | 0.79% | 1.0% |
| Standard Deviation (Population) | 0.77% | 1.0% |
Demographics Similar to Puget Sound Salish and Thais by 1st Grade
In terms of 1st grade, the demographic groups most similar to Puget Sound Salish are Colville (98.2%, a difference of 0.010%), Romanian (98.2%, a difference of 0.020%), Cree (98.2%, a difference of 0.020%), Immigrants from Ireland (98.2%, a difference of 0.020%), and Pima (98.2%, a difference of 0.030%). Similarly, the demographic groups most similar to Thais are Yugoslavian (98.2%, a difference of 0.010%), Immigrants from France (98.2%, a difference of 0.010%), Iranian (98.2%, a difference of 0.020%), Spanish (98.2%, a difference of 0.020%), and Immigrants from Norway (98.2%, a difference of 0.030%).
| Demographics | Rating | Rank | 1st Grade |
| Puget Sound Salish | 98.2 /100 | #99 | Exceptional 98.2% |
| Colville | 98.0 /100 | #100 | Exceptional 98.2% |
| Romanians | 97.8 /100 | #101 | Exceptional 98.2% |
| Cree | 97.8 /100 | #102 | Exceptional 98.2% |
| Immigrants | Ireland | 97.7 /100 | #103 | Exceptional 98.2% |
| Pima | 97.5 /100 | #104 | Exceptional 98.2% |
| Basques | 97.4 /100 | #105 | Exceptional 98.2% |
| Turks | 97.4 /100 | #106 | Exceptional 98.2% |
| Immigrants | Switzerland | 97.3 /100 | #107 | Exceptional 98.2% |
| Bhutanese | 97.3 /100 | #108 | Exceptional 98.2% |
| German Russians | 97.1 /100 | #109 | Exceptional 98.2% |
| Immigrants | Singapore | 96.7 /100 | #110 | Exceptional 98.2% |
| Immigrants | Czechoslovakia | 96.6 /100 | #111 | Exceptional 98.2% |
| Immigrants | Norway | 96.6 /100 | #112 | Exceptional 98.2% |
| Immigrants | Latvia | 96.4 /100 | #113 | Exceptional 98.2% |
| Ute | 96.2 /100 | #114 | Exceptional 98.2% |
| Iranians | 96.0 /100 | #115 | Exceptional 98.2% |
| Spanish | 95.9 /100 | #116 | Exceptional 98.2% |
| Yugoslavians | 95.5 /100 | #117 | Exceptional 98.2% |
| Immigrants | France | 95.5 /100 | #118 | Exceptional 98.2% |
| Thais | 94.7 /100 | #119 | Exceptional 98.1% |