New Zealander vs Thai In Labor Force | Age 45-54
COMPARE
New Zealander
Thai
In Labor Force | Age 45-54
In Labor Force | Age 45-54 Comparison
New Zealanders
Thais
82.6%
IN LABOR FORCE | AGE 45-54
32.7/ 100
METRIC RATING
183rd/ 347
METRIC RANK
84.3%
IN LABOR FORCE | AGE 45-54
100.0/ 100
METRIC RATING
11th/ 347
METRIC RANK
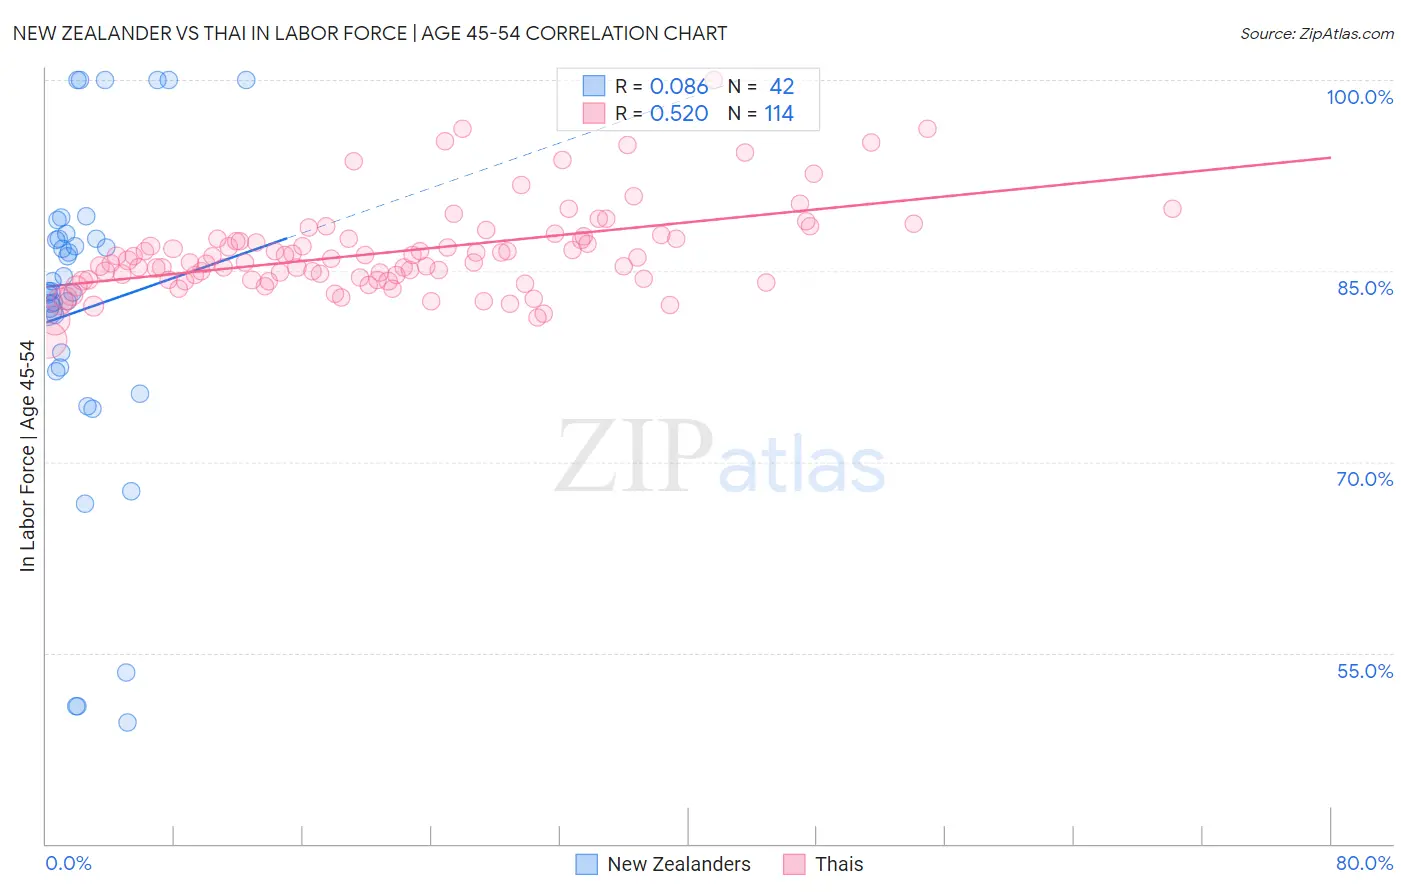
New Zealander vs Thai In Labor Force | Age 45-54 Correlation Chart
The statistical analysis conducted on geographies consisting of 106,893,941 people shows a slight positive correlation between the proportion of New Zealanders and labor force participation rate among population between the ages 45 and 54 in the United States with a correlation coefficient (R) of 0.086 and weighted average of 82.6%. Similarly, the statistical analysis conducted on geographies consisting of 475,327,867 people shows a substantial positive correlation between the proportion of Thais and labor force participation rate among population between the ages 45 and 54 in the United States with a correlation coefficient (R) of 0.520 and weighted average of 84.3%, a difference of 2.1%.
In Labor Force | Age 45-54 Correlation Summary
| Measurement | New Zealander | Thai |
| Minimum | 49.5% | 79.5% |
| Maximum | 100.0% | 100.0% |
| Range | 50.5% | 20.5% |
| Mean | 82.0% | 86.5% |
| Median | 83.4% | 85.8% |
| Interquartile 25% (IQ1) | 77.4% | 84.3% |
| Interquartile 75% (IQ3) | 87.5% | 87.5% |
| Interquartile Range (IQR) | 10.1% | 3.2% |
| Standard Deviation (Sample) | 12.9% | 3.5% |
| Standard Deviation (Population) | 12.7% | 3.5% |
Similar Demographics by In Labor Force | Age 45-54
Demographics Similar to New Zealanders by In Labor Force | Age 45-54
In terms of in labor force | age 45-54, the demographic groups most similar to New Zealanders are European (82.6%, a difference of 0.0%), Immigrants from England (82.6%, a difference of 0.0%), Immigrants from Hungary (82.7%, a difference of 0.040%), Irish (82.6%, a difference of 0.040%), and Hungarian (82.7%, a difference of 0.050%).
| Demographics | Rating | Rank | In Labor Force | Age 45-54 |
| Northern Europeans | 46.9 /100 | #176 | Average 82.7% |
| Immigrants | Nicaragua | 44.6 /100 | #177 | Average 82.7% |
| Nigerians | 40.5 /100 | #178 | Average 82.7% |
| Immigrants | Switzerland | 39.4 /100 | #179 | Fair 82.7% |
| Hungarians | 38.0 /100 | #180 | Fair 82.7% |
| Israelis | 37.7 /100 | #181 | Fair 82.7% |
| Immigrants | Hungary | 37.1 /100 | #182 | Fair 82.7% |
| New Zealanders | 32.7 /100 | #183 | Fair 82.6% |
| Europeans | 32.6 /100 | #184 | Fair 82.6% |
| Immigrants | England | 32.2 /100 | #185 | Fair 82.6% |
| Irish | 29.2 /100 | #186 | Fair 82.6% |
| Immigrants | Costa Rica | 28.3 /100 | #187 | Fair 82.6% |
| South Africans | 28.0 /100 | #188 | Fair 82.6% |
| Syrians | 26.0 /100 | #189 | Fair 82.6% |
| British | 25.7 /100 | #190 | Fair 82.6% |
Demographics Similar to Thais by In Labor Force | Age 45-54
In terms of in labor force | age 45-54, the demographic groups most similar to Thais are Norwegian (84.4%, a difference of 0.090%), Immigrants from Sierra Leone (84.4%, a difference of 0.11%), Bulgarian (84.2%, a difference of 0.11%), Sierra Leonean (84.5%, a difference of 0.22%), and Chinese (84.1%, a difference of 0.22%).
| Demographics | Rating | Rank | In Labor Force | Age 45-54 |
| Immigrants | Ethiopia | 100.0 /100 | #4 | Exceptional 84.8% |
| Ethiopians | 100.0 /100 | #5 | Exceptional 84.8% |
| Immigrants | India | 100.0 /100 | #6 | Exceptional 84.7% |
| Immigrants | Cameroon | 100.0 /100 | #7 | Exceptional 84.6% |
| Sierra Leoneans | 100.0 /100 | #8 | Exceptional 84.5% |
| Immigrants | Sierra Leone | 100.0 /100 | #9 | Exceptional 84.4% |
| Norwegians | 100.0 /100 | #10 | Exceptional 84.4% |
| Thais | 100.0 /100 | #11 | Exceptional 84.3% |
| Bulgarians | 100.0 /100 | #12 | Exceptional 84.2% |
| Chinese | 99.9 /100 | #13 | Exceptional 84.1% |
| Cambodians | 99.9 /100 | #14 | Exceptional 84.1% |
| Cypriots | 99.9 /100 | #15 | Exceptional 84.1% |
| Immigrants | Nepal | 99.9 /100 | #16 | Exceptional 84.0% |
| Zimbabweans | 99.9 /100 | #17 | Exceptional 84.0% |
| Immigrants | South Central Asia | 99.9 /100 | #18 | Exceptional 84.0% |