Puget Sound Salish vs Immigrants from St. Vincent and the Grenadines In Labor Force | Age 45-54
COMPARE
Puget Sound Salish
Immigrants from St. Vincent and the Grenadines
In Labor Force | Age 45-54
In Labor Force | Age 45-54 Comparison
Puget Sound Salish
Immigrants from St. Vincent and the Grenadines
81.7%
IN LABOR FORCE | AGE 45-54
0.3/ 100
METRIC RATING
248th/ 347
METRIC RANK
81.4%
IN LABOR FORCE | AGE 45-54
0.1/ 100
METRIC RATING
266th/ 347
METRIC RANK
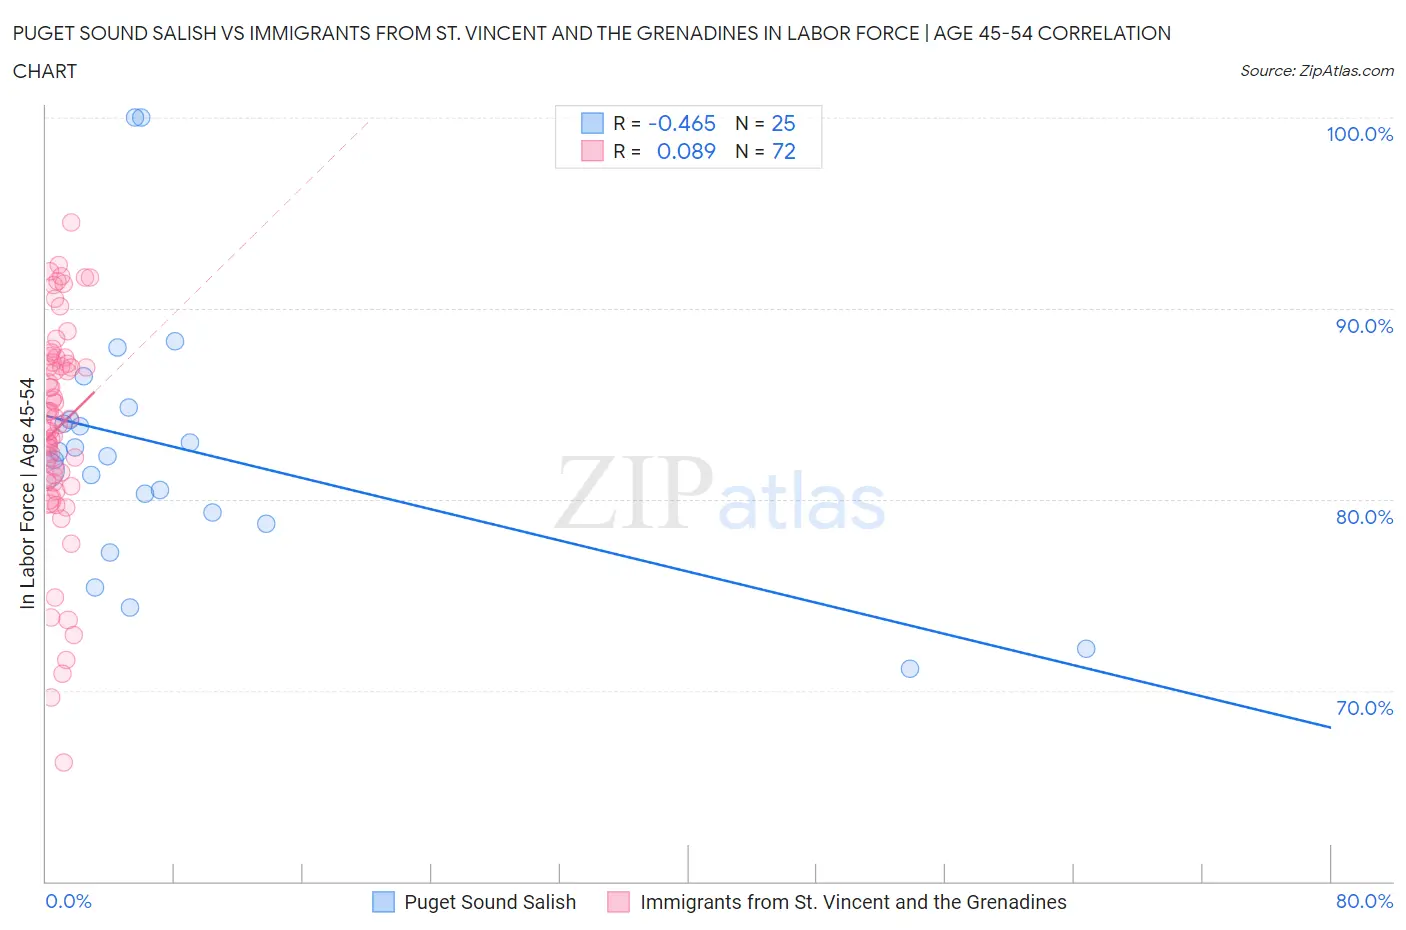
Puget Sound Salish vs Immigrants from St. Vincent and the Grenadines In Labor Force | Age 45-54 Correlation Chart
The statistical analysis conducted on geographies consisting of 46,155,746 people shows a moderate negative correlation between the proportion of Puget Sound Salish and labor force participation rate among population between the ages 45 and 54 in the United States with a correlation coefficient (R) of -0.465 and weighted average of 81.7%. Similarly, the statistical analysis conducted on geographies consisting of 56,188,092 people shows a slight positive correlation between the proportion of Immigrants from St. Vincent and the Grenadines and labor force participation rate among population between the ages 45 and 54 in the United States with a correlation coefficient (R) of 0.089 and weighted average of 81.4%, a difference of 0.42%.
In Labor Force | Age 45-54 Correlation Summary
| Measurement | Puget Sound Salish | Immigrants from St. Vincent and the Grenadines |
| Minimum | 71.1% | 66.2% |
| Maximum | 100.0% | 94.5% |
| Range | 28.9% | 28.3% |
| Mean | 82.6% | 83.7% |
| Median | 82.2% | 84.3% |
| Interquartile 25% (IQ1) | 79.0% | 80.9% |
| Interquartile 75% (IQ3) | 84.5% | 87.3% |
| Interquartile Range (IQR) | 5.5% | 6.4% |
| Standard Deviation (Sample) | 6.8% | 5.7% |
| Standard Deviation (Population) | 6.7% | 5.7% |
Demographics Similar to Puget Sound Salish and Immigrants from St. Vincent and the Grenadines by In Labor Force | Age 45-54
In terms of in labor force | age 45-54, the demographic groups most similar to Puget Sound Salish are Central American (81.7%, a difference of 0.020%), Hmong (81.7%, a difference of 0.020%), Immigrants from Armenia (81.7%, a difference of 0.070%), Guamanian/Chamorro (81.6%, a difference of 0.10%), and Pennsylvania German (81.6%, a difference of 0.11%). Similarly, the demographic groups most similar to Immigrants from St. Vincent and the Grenadines are West Indian (81.4%, a difference of 0.0%), Honduran (81.4%, a difference of 0.080%), Indonesian (81.5%, a difference of 0.13%), Immigrants from West Indies (81.5%, a difference of 0.13%), and Immigrants from Guyana (81.5%, a difference of 0.14%).
| Demographics | Rating | Rank | In Labor Force | Age 45-54 |
| Central Americans | 0.4 /100 | #247 | Tragic 81.7% |
| Puget Sound Salish | 0.3 /100 | #248 | Tragic 81.7% |
| Hmong | 0.3 /100 | #249 | Tragic 81.7% |
| Immigrants | Armenia | 0.2 /100 | #250 | Tragic 81.7% |
| Guamanians/Chamorros | 0.2 /100 | #251 | Tragic 81.6% |
| Pennsylvania Germans | 0.2 /100 | #252 | Tragic 81.6% |
| Japanese | 0.2 /100 | #253 | Tragic 81.6% |
| Immigrants | Laos | 0.2 /100 | #254 | Tragic 81.6% |
| Scotch-Irish | 0.2 /100 | #255 | Tragic 81.6% |
| Barbadians | 0.1 /100 | #256 | Tragic 81.6% |
| Immigrants | Congo | 0.1 /100 | #257 | Tragic 81.6% |
| Immigrants | Fiji | 0.1 /100 | #258 | Tragic 81.5% |
| Guyanese | 0.1 /100 | #259 | Tragic 81.5% |
| Spaniards | 0.1 /100 | #260 | Tragic 81.5% |
| Hawaiians | 0.1 /100 | #261 | Tragic 81.5% |
| Immigrants | Guyana | 0.1 /100 | #262 | Tragic 81.5% |
| Indonesians | 0.1 /100 | #263 | Tragic 81.5% |
| Immigrants | West Indies | 0.1 /100 | #264 | Tragic 81.5% |
| Hondurans | 0.1 /100 | #265 | Tragic 81.4% |
| Immigrants | St. Vincent and the Grenadines | 0.1 /100 | #266 | Tragic 81.4% |
| West Indians | 0.1 /100 | #267 | Tragic 81.4% |