Immigrants from Fiji vs Thai In Labor Force | Age 45-54
COMPARE
Immigrants from Fiji
Thai
In Labor Force | Age 45-54
In Labor Force | Age 45-54 Comparison
Immigrants from Fiji
Thais
81.5%
IN LABOR FORCE | AGE 45-54
0.1/ 100
METRIC RATING
258th/ 347
METRIC RANK
84.3%
IN LABOR FORCE | AGE 45-54
100.0/ 100
METRIC RATING
11th/ 347
METRIC RANK
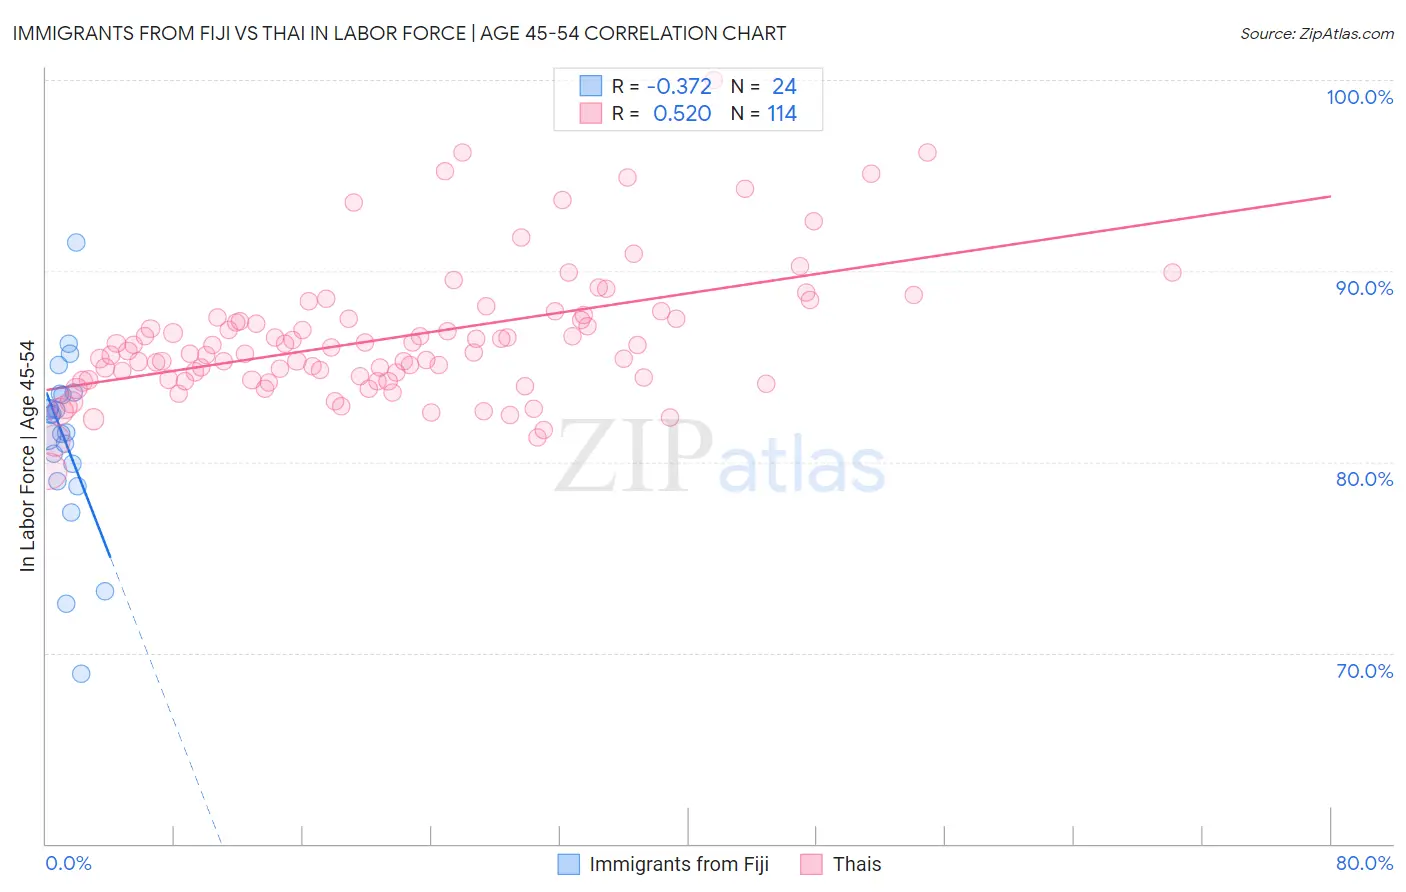
Immigrants from Fiji vs Thai In Labor Force | Age 45-54 Correlation Chart
The statistical analysis conducted on geographies consisting of 93,754,712 people shows a mild negative correlation between the proportion of Immigrants from Fiji and labor force participation rate among population between the ages 45 and 54 in the United States with a correlation coefficient (R) of -0.372 and weighted average of 81.5%. Similarly, the statistical analysis conducted on geographies consisting of 475,327,867 people shows a substantial positive correlation between the proportion of Thais and labor force participation rate among population between the ages 45 and 54 in the United States with a correlation coefficient (R) of 0.520 and weighted average of 84.3%, a difference of 3.4%.
In Labor Force | Age 45-54 Correlation Summary
| Measurement | Immigrants from Fiji | Thai |
| Minimum | 68.9% | 79.5% |
| Maximum | 91.5% | 100.0% |
| Range | 22.6% | 20.5% |
| Mean | 81.2% | 86.5% |
| Median | 82.0% | 85.8% |
| Interquartile 25% (IQ1) | 79.5% | 84.3% |
| Interquartile 75% (IQ3) | 83.6% | 87.5% |
| Interquartile Range (IQR) | 4.1% | 3.2% |
| Standard Deviation (Sample) | 4.7% | 3.5% |
| Standard Deviation (Population) | 4.6% | 3.5% |
Similar Demographics by In Labor Force | Age 45-54
Demographics Similar to Immigrants from Fiji by In Labor Force | Age 45-54
In terms of in labor force | age 45-54, the demographic groups most similar to Immigrants from Fiji are Immigrants from Congo (81.6%, a difference of 0.010%), Guyanese (81.5%, a difference of 0.010%), Barbadian (81.6%, a difference of 0.030%), Spaniard (81.5%, a difference of 0.030%), and Hawaiian (81.5%, a difference of 0.050%).
| Demographics | Rating | Rank | In Labor Force | Age 45-54 |
| Guamanians/Chamorros | 0.2 /100 | #251 | Tragic 81.6% |
| Pennsylvania Germans | 0.2 /100 | #252 | Tragic 81.6% |
| Japanese | 0.2 /100 | #253 | Tragic 81.6% |
| Immigrants | Laos | 0.2 /100 | #254 | Tragic 81.6% |
| Scotch-Irish | 0.2 /100 | #255 | Tragic 81.6% |
| Barbadians | 0.1 /100 | #256 | Tragic 81.6% |
| Immigrants | Congo | 0.1 /100 | #257 | Tragic 81.6% |
| Immigrants | Fiji | 0.1 /100 | #258 | Tragic 81.5% |
| Guyanese | 0.1 /100 | #259 | Tragic 81.5% |
| Spaniards | 0.1 /100 | #260 | Tragic 81.5% |
| Hawaiians | 0.1 /100 | #261 | Tragic 81.5% |
| Immigrants | Guyana | 0.1 /100 | #262 | Tragic 81.5% |
| Indonesians | 0.1 /100 | #263 | Tragic 81.5% |
| Immigrants | West Indies | 0.1 /100 | #264 | Tragic 81.5% |
| Hondurans | 0.1 /100 | #265 | Tragic 81.4% |
Demographics Similar to Thais by In Labor Force | Age 45-54
In terms of in labor force | age 45-54, the demographic groups most similar to Thais are Norwegian (84.4%, a difference of 0.090%), Immigrants from Sierra Leone (84.4%, a difference of 0.11%), Bulgarian (84.2%, a difference of 0.11%), Sierra Leonean (84.5%, a difference of 0.22%), and Chinese (84.1%, a difference of 0.22%).
| Demographics | Rating | Rank | In Labor Force | Age 45-54 |
| Immigrants | Ethiopia | 100.0 /100 | #4 | Exceptional 84.8% |
| Ethiopians | 100.0 /100 | #5 | Exceptional 84.8% |
| Immigrants | India | 100.0 /100 | #6 | Exceptional 84.7% |
| Immigrants | Cameroon | 100.0 /100 | #7 | Exceptional 84.6% |
| Sierra Leoneans | 100.0 /100 | #8 | Exceptional 84.5% |
| Immigrants | Sierra Leone | 100.0 /100 | #9 | Exceptional 84.4% |
| Norwegians | 100.0 /100 | #10 | Exceptional 84.4% |
| Thais | 100.0 /100 | #11 | Exceptional 84.3% |
| Bulgarians | 100.0 /100 | #12 | Exceptional 84.2% |
| Chinese | 99.9 /100 | #13 | Exceptional 84.1% |
| Cambodians | 99.9 /100 | #14 | Exceptional 84.1% |
| Cypriots | 99.9 /100 | #15 | Exceptional 84.1% |
| Immigrants | Nepal | 99.9 /100 | #16 | Exceptional 84.0% |
| Zimbabweans | 99.9 /100 | #17 | Exceptional 84.0% |
| Immigrants | South Central Asia | 99.9 /100 | #18 | Exceptional 84.0% |