Puget Sound Salish vs Immigrants from Brazil In Labor Force | Age 45-54
COMPARE
Puget Sound Salish
Immigrants from Brazil
In Labor Force | Age 45-54
In Labor Force | Age 45-54 Comparison
Puget Sound Salish
Immigrants from Brazil
81.7%
IN LABOR FORCE | AGE 45-54
0.3/ 100
METRIC RATING
248th/ 347
METRIC RANK
83.9%
IN LABOR FORCE | AGE 45-54
99.8/ 100
METRIC RATING
27th/ 347
METRIC RANK
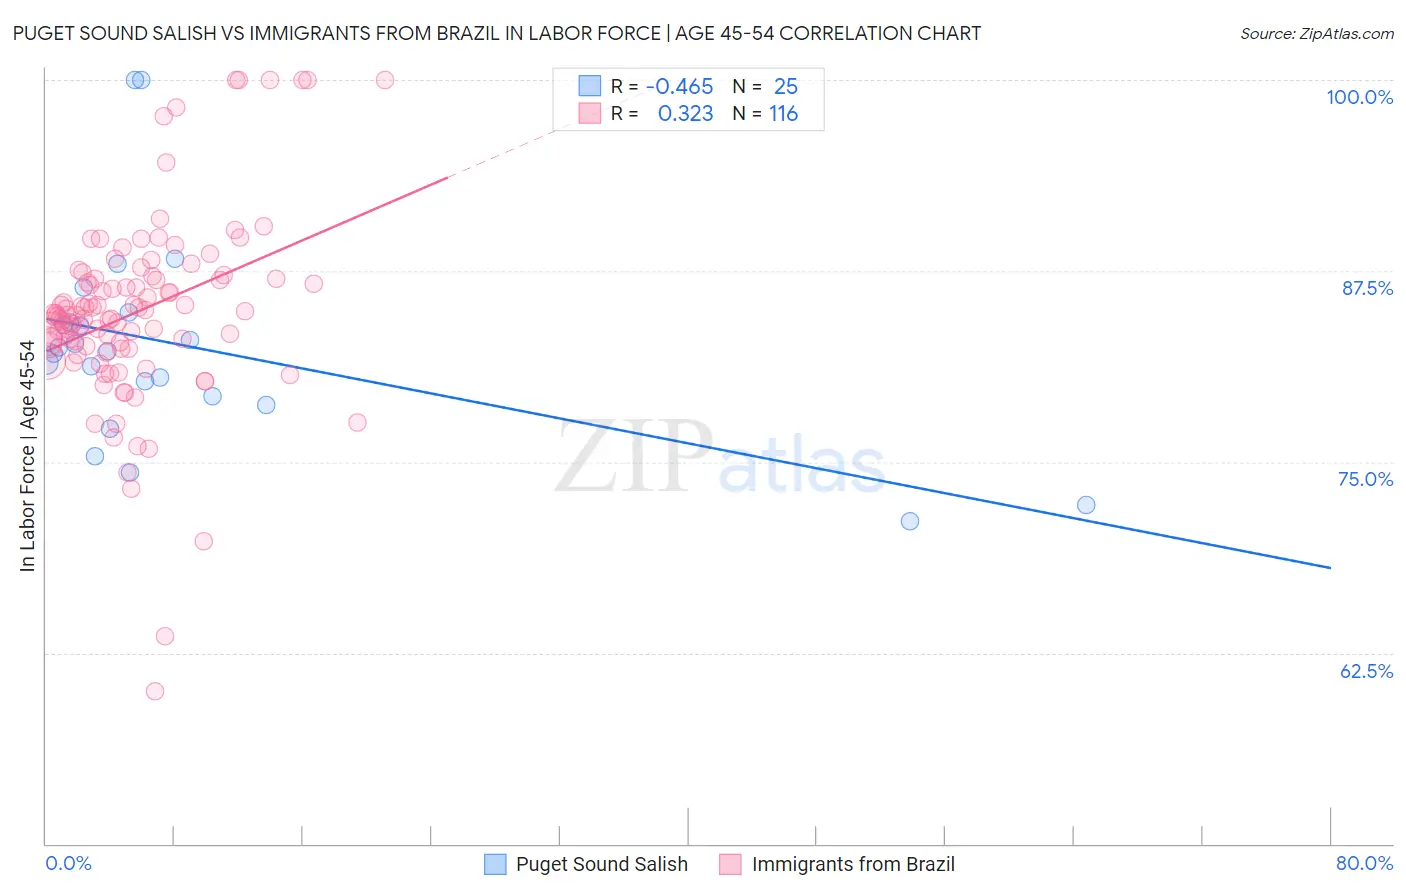
Puget Sound Salish vs Immigrants from Brazil In Labor Force | Age 45-54 Correlation Chart
The statistical analysis conducted on geographies consisting of 46,155,746 people shows a moderate negative correlation between the proportion of Puget Sound Salish and labor force participation rate among population between the ages 45 and 54 in the United States with a correlation coefficient (R) of -0.465 and weighted average of 81.7%. Similarly, the statistical analysis conducted on geographies consisting of 342,845,252 people shows a mild positive correlation between the proportion of Immigrants from Brazil and labor force participation rate among population between the ages 45 and 54 in the United States with a correlation coefficient (R) of 0.323 and weighted average of 83.9%, a difference of 2.6%.
In Labor Force | Age 45-54 Correlation Summary
| Measurement | Puget Sound Salish | Immigrants from Brazil |
| Minimum | 71.1% | 60.0% |
| Maximum | 100.0% | 100.0% |
| Range | 28.9% | 40.0% |
| Mean | 82.6% | 84.8% |
| Median | 82.2% | 84.6% |
| Interquartile 25% (IQ1) | 79.0% | 82.5% |
| Interquartile 75% (IQ3) | 84.5% | 87.0% |
| Interquartile Range (IQR) | 5.5% | 4.5% |
| Standard Deviation (Sample) | 6.8% | 6.2% |
| Standard Deviation (Population) | 6.7% | 6.2% |
Similar Demographics by In Labor Force | Age 45-54
Demographics Similar to Puget Sound Salish by In Labor Force | Age 45-54
In terms of in labor force | age 45-54, the demographic groups most similar to Puget Sound Salish are Central American (81.7%, a difference of 0.020%), Hmong (81.7%, a difference of 0.020%), Alaskan Athabascan (81.8%, a difference of 0.040%), Alaska Native (81.8%, a difference of 0.050%), and Celtic (81.8%, a difference of 0.060%).
| Demographics | Rating | Rank | In Labor Force | Age 45-54 |
| Immigrants | Cambodia | 0.8 /100 | #241 | Tragic 81.9% |
| Whites/Caucasians | 0.7 /100 | #242 | Tragic 81.9% |
| Samoans | 0.6 /100 | #243 | Tragic 81.8% |
| Celtics | 0.4 /100 | #244 | Tragic 81.8% |
| Alaska Natives | 0.4 /100 | #245 | Tragic 81.8% |
| Alaskan Athabascans | 0.4 /100 | #246 | Tragic 81.8% |
| Central Americans | 0.4 /100 | #247 | Tragic 81.7% |
| Puget Sound Salish | 0.3 /100 | #248 | Tragic 81.7% |
| Hmong | 0.3 /100 | #249 | Tragic 81.7% |
| Immigrants | Armenia | 0.2 /100 | #250 | Tragic 81.7% |
| Guamanians/Chamorros | 0.2 /100 | #251 | Tragic 81.6% |
| Pennsylvania Germans | 0.2 /100 | #252 | Tragic 81.6% |
| Japanese | 0.2 /100 | #253 | Tragic 81.6% |
| Immigrants | Laos | 0.2 /100 | #254 | Tragic 81.6% |
| Scotch-Irish | 0.2 /100 | #255 | Tragic 81.6% |
Demographics Similar to Immigrants from Brazil by In Labor Force | Age 45-54
In terms of in labor force | age 45-54, the demographic groups most similar to Immigrants from Brazil are Immigrants from Serbia (83.9%, a difference of 0.010%), Immigrants from Lithuania (83.9%, a difference of 0.010%), Immigrants from North Macedonia (83.9%, a difference of 0.020%), Immigrants from Pakistan (83.8%, a difference of 0.030%), and Slovene (83.9%, a difference of 0.040%).
| Demographics | Rating | Rank | In Labor Force | Age 45-54 |
| Immigrants | Eastern Africa | 99.8 /100 | #20 | Exceptional 83.9% |
| Immigrants | Sri Lanka | 99.8 /100 | #21 | Exceptional 83.9% |
| Immigrants | Ireland | 99.8 /100 | #22 | Exceptional 83.9% |
| Tlingit-Haida | 99.8 /100 | #23 | Exceptional 83.9% |
| Slovenes | 99.8 /100 | #24 | Exceptional 83.9% |
| Immigrants | North Macedonia | 99.8 /100 | #25 | Exceptional 83.9% |
| Immigrants | Serbia | 99.8 /100 | #26 | Exceptional 83.9% |
| Immigrants | Brazil | 99.8 /100 | #27 | Exceptional 83.9% |
| Immigrants | Lithuania | 99.8 /100 | #28 | Exceptional 83.9% |
| Immigrants | Pakistan | 99.7 /100 | #29 | Exceptional 83.8% |
| Immigrants | Bulgaria | 99.7 /100 | #30 | Exceptional 83.8% |
| Immigrants | Eritrea | 99.7 /100 | #31 | Exceptional 83.8% |
| Turks | 99.7 /100 | #32 | Exceptional 83.8% |
| Latvians | 99.7 /100 | #33 | Exceptional 83.8% |
| Kenyans | 99.5 /100 | #34 | Exceptional 83.7% |