Puget Sound Salish vs Immigrants from Saudi Arabia In Labor Force | Age 45-54
COMPARE
Puget Sound Salish
Immigrants from Saudi Arabia
In Labor Force | Age 45-54
In Labor Force | Age 45-54 Comparison
Puget Sound Salish
Immigrants from Saudi Arabia
81.7%
IN LABOR FORCE | AGE 45-54
0.3/ 100
METRIC RATING
248th/ 347
METRIC RANK
82.9%
IN LABOR FORCE | AGE 45-54
68.8/ 100
METRIC RATING
156th/ 347
METRIC RANK
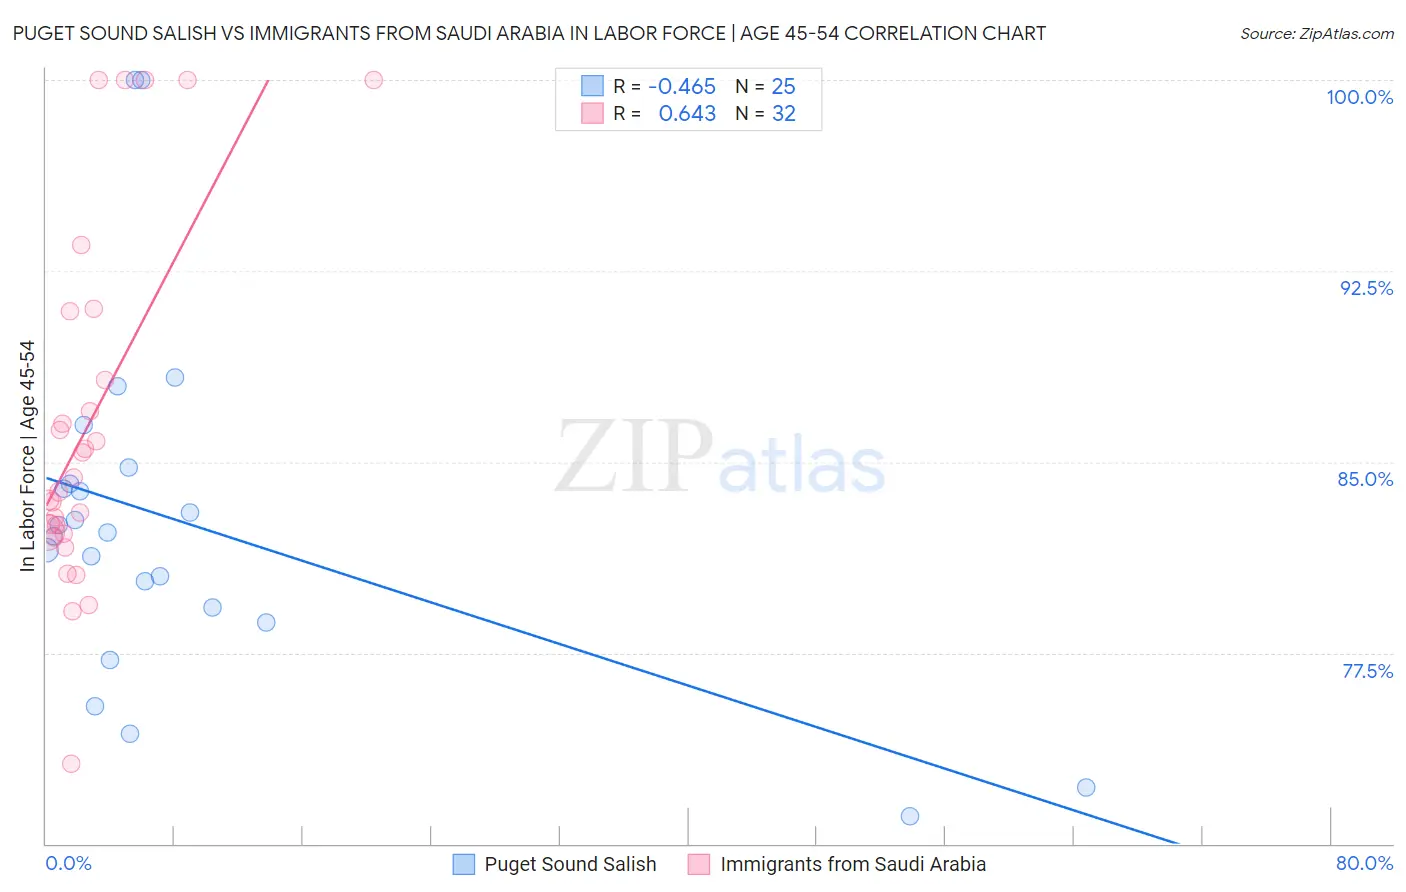
Puget Sound Salish vs Immigrants from Saudi Arabia In Labor Force | Age 45-54 Correlation Chart
The statistical analysis conducted on geographies consisting of 46,155,746 people shows a moderate negative correlation between the proportion of Puget Sound Salish and labor force participation rate among population between the ages 45 and 54 in the United States with a correlation coefficient (R) of -0.465 and weighted average of 81.7%. Similarly, the statistical analysis conducted on geographies consisting of 164,195,030 people shows a significant positive correlation between the proportion of Immigrants from Saudi Arabia and labor force participation rate among population between the ages 45 and 54 in the United States with a correlation coefficient (R) of 0.643 and weighted average of 82.9%, a difference of 1.5%.
In Labor Force | Age 45-54 Correlation Summary
| Measurement | Puget Sound Salish | Immigrants from Saudi Arabia |
| Minimum | 71.1% | 73.1% |
| Maximum | 100.0% | 100.0% |
| Range | 28.9% | 26.9% |
| Mean | 82.6% | 86.5% |
| Median | 82.2% | 84.1% |
| Interquartile 25% (IQ1) | 79.0% | 82.2% |
| Interquartile 75% (IQ3) | 84.5% | 89.5% |
| Interquartile Range (IQR) | 5.5% | 7.3% |
| Standard Deviation (Sample) | 6.8% | 7.0% |
| Standard Deviation (Population) | 6.7% | 6.9% |
Similar Demographics by In Labor Force | Age 45-54
Demographics Similar to Puget Sound Salish by In Labor Force | Age 45-54
In terms of in labor force | age 45-54, the demographic groups most similar to Puget Sound Salish are Central American (81.7%, a difference of 0.020%), Hmong (81.7%, a difference of 0.020%), Alaskan Athabascan (81.8%, a difference of 0.040%), Alaska Native (81.8%, a difference of 0.050%), and Celtic (81.8%, a difference of 0.060%).
| Demographics | Rating | Rank | In Labor Force | Age 45-54 |
| Immigrants | Cambodia | 0.8 /100 | #241 | Tragic 81.9% |
| Whites/Caucasians | 0.7 /100 | #242 | Tragic 81.9% |
| Samoans | 0.6 /100 | #243 | Tragic 81.8% |
| Celtics | 0.4 /100 | #244 | Tragic 81.8% |
| Alaska Natives | 0.4 /100 | #245 | Tragic 81.8% |
| Alaskan Athabascans | 0.4 /100 | #246 | Tragic 81.8% |
| Central Americans | 0.4 /100 | #247 | Tragic 81.7% |
| Puget Sound Salish | 0.3 /100 | #248 | Tragic 81.7% |
| Hmong | 0.3 /100 | #249 | Tragic 81.7% |
| Immigrants | Armenia | 0.2 /100 | #250 | Tragic 81.7% |
| Guamanians/Chamorros | 0.2 /100 | #251 | Tragic 81.6% |
| Pennsylvania Germans | 0.2 /100 | #252 | Tragic 81.6% |
| Japanese | 0.2 /100 | #253 | Tragic 81.6% |
| Immigrants | Laos | 0.2 /100 | #254 | Tragic 81.6% |
| Scotch-Irish | 0.2 /100 | #255 | Tragic 81.6% |
Demographics Similar to Immigrants from Saudi Arabia by In Labor Force | Age 45-54
In terms of in labor force | age 45-54, the demographic groups most similar to Immigrants from Saudi Arabia are Immigrants from Philippines (82.9%, a difference of 0.0%), Immigrants from Australia (82.9%, a difference of 0.010%), Immigrants from Southern Europe (82.9%, a difference of 0.010%), Immigrants from Indonesia (82.9%, a difference of 0.020%), and Immigrants from Ghana (82.9%, a difference of 0.020%).
| Demographics | Rating | Rank | In Labor Force | Age 45-54 |
| Immigrants | Sweden | 73.3 /100 | #149 | Good 82.9% |
| Immigrants | Netherlands | 72.6 /100 | #150 | Good 82.9% |
| Koreans | 71.9 /100 | #151 | Good 82.9% |
| Slavs | 71.5 /100 | #152 | Good 82.9% |
| Immigrants | Indonesia | 70.6 /100 | #153 | Good 82.9% |
| Immigrants | Ghana | 70.3 /100 | #154 | Good 82.9% |
| Immigrants | Philippines | 69.0 /100 | #155 | Good 82.9% |
| Immigrants | Saudi Arabia | 68.8 /100 | #156 | Good 82.9% |
| Immigrants | Australia | 68.2 /100 | #157 | Good 82.9% |
| Immigrants | Southern Europe | 67.8 /100 | #158 | Good 82.9% |
| Immigrants | Austria | 64.6 /100 | #159 | Good 82.9% |
| Laotians | 62.8 /100 | #160 | Good 82.9% |
| South American Indians | 62.2 /100 | #161 | Good 82.9% |
| Haitians | 61.8 /100 | #162 | Good 82.8% |
| Dutch | 61.7 /100 | #163 | Good 82.8% |