Puget Sound Salish vs Thai Unemployment Among Ages 30 to 34 years
COMPARE
Puget Sound Salish
Thai
Unemployment Among Ages 30 to 34 years
Unemployment Among Ages 30 to 34 years Comparison
Puget Sound Salish
Thais
5.1%
UNEMPLOYMENT AMONG AGES 30 TO 34 YEARS
98.2/ 100
METRIC RATING
50th/ 347
METRIC RANK
4.7%
UNEMPLOYMENT AMONG AGES 30 TO 34 YEARS
100.0/ 100
METRIC RATING
7th/ 347
METRIC RANK
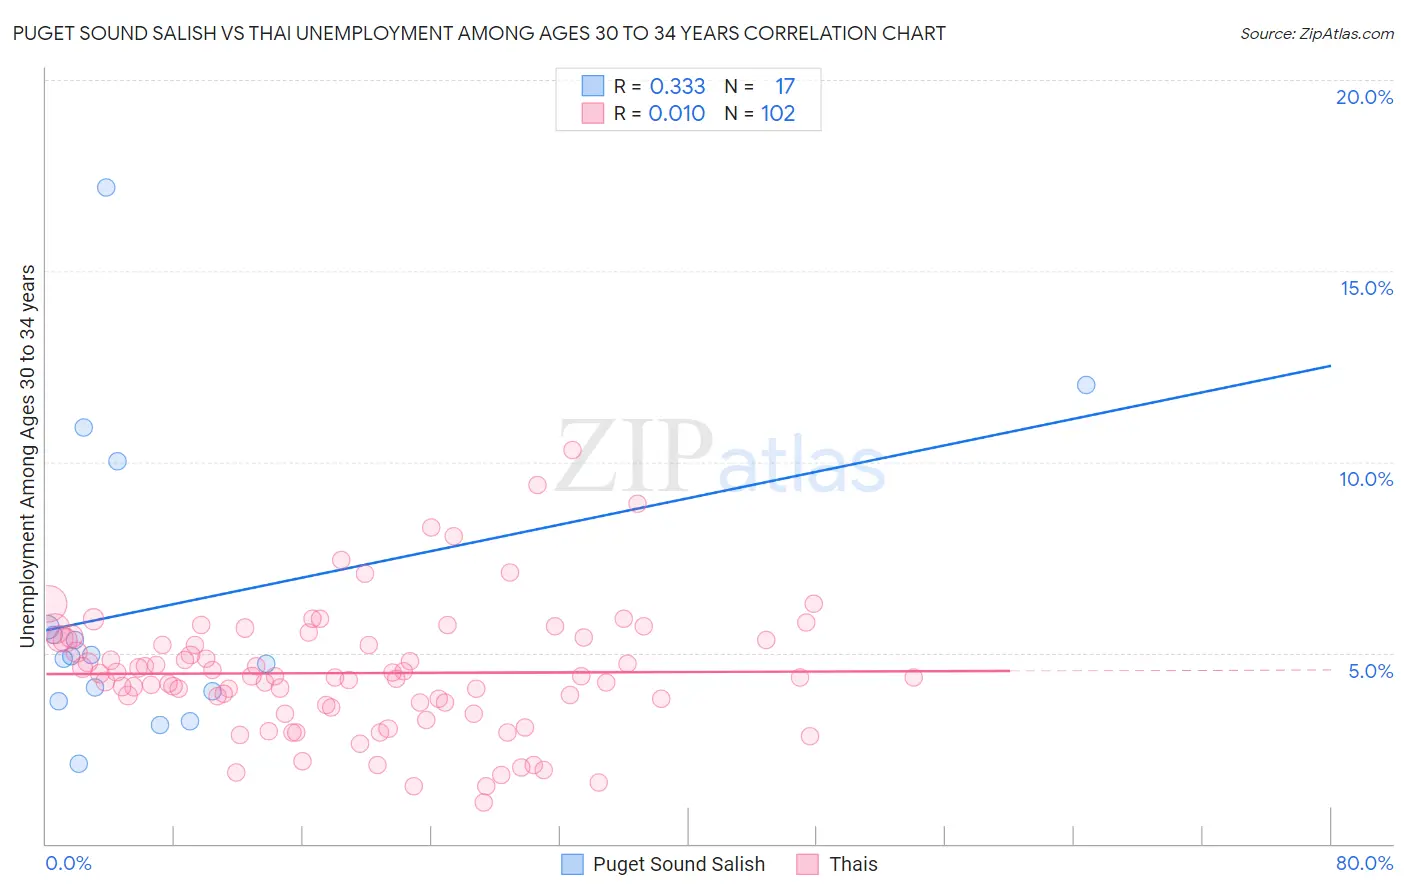
Puget Sound Salish vs Thai Unemployment Among Ages 30 to 34 years Correlation Chart
The statistical analysis conducted on geographies consisting of 45,325,090 people shows a mild positive correlation between the proportion of Puget Sound Salish and unemployment rate among population between the ages 30 and 34 in the United States with a correlation coefficient (R) of 0.333 and weighted average of 5.1%. Similarly, the statistical analysis conducted on geographies consisting of 441,217,021 people shows no correlation between the proportion of Thais and unemployment rate among population between the ages 30 and 34 in the United States with a correlation coefficient (R) of 0.010 and weighted average of 4.7%, a difference of 7.7%.
Unemployment Among Ages 30 to 34 years Correlation Summary
| Measurement | Puget Sound Salish | Thai |
| Minimum | 2.1% | 1.1% |
| Maximum | 17.2% | 10.3% |
| Range | 15.1% | 9.2% |
| Mean | 6.2% | 4.5% |
| Median | 4.9% | 4.4% |
| Interquartile 25% (IQ1) | 3.9% | 3.6% |
| Interquartile 75% (IQ3) | 7.9% | 5.3% |
| Interquartile Range (IQR) | 4.0% | 1.7% |
| Standard Deviation (Sample) | 4.0% | 1.7% |
| Standard Deviation (Population) | 3.8% | 1.6% |
Similar Demographics by Unemployment Among Ages 30 to 34 years
Demographics Similar to Puget Sound Salish by Unemployment Among Ages 30 to 34 years
In terms of unemployment among ages 30 to 34 years, the demographic groups most similar to Puget Sound Salish are Turkish (5.1%, a difference of 0.030%), Immigrants from Burma/Myanmar (5.1%, a difference of 0.070%), Immigrants from Malaysia (5.1%, a difference of 0.080%), Cuban (5.1%, a difference of 0.12%), and Assyrian/Chaldean/Syriac (5.1%, a difference of 0.20%).
| Demographics | Rating | Rank | Unemployment Among Ages 30 to 34 years |
| Soviet Union | 98.8 /100 | #43 | Exceptional 5.0% |
| Immigrants | Belgium | 98.7 /100 | #44 | Exceptional 5.1% |
| Yugoslavians | 98.6 /100 | #45 | Exceptional 5.1% |
| Immigrants | Congo | 98.4 /100 | #46 | Exceptional 5.1% |
| Cypriots | 98.4 /100 | #47 | Exceptional 5.1% |
| Assyrians/Chaldeans/Syriacs | 98.4 /100 | #48 | Exceptional 5.1% |
| Immigrants | Malaysia | 98.3 /100 | #49 | Exceptional 5.1% |
| Puget Sound Salish | 98.2 /100 | #50 | Exceptional 5.1% |
| Turks | 98.2 /100 | #51 | Exceptional 5.1% |
| Immigrants | Burma/Myanmar | 98.1 /100 | #52 | Exceptional 5.1% |
| Cubans | 98.1 /100 | #53 | Exceptional 5.1% |
| Immigrants | Morocco | 97.9 /100 | #54 | Exceptional 5.1% |
| Chinese | 97.7 /100 | #55 | Exceptional 5.1% |
| Immigrants | Serbia | 97.4 /100 | #56 | Exceptional 5.1% |
| Immigrants | China | 97.2 /100 | #57 | Exceptional 5.1% |
Demographics Similar to Thais by Unemployment Among Ages 30 to 34 years
In terms of unemployment among ages 30 to 34 years, the demographic groups most similar to Thais are Immigrants from Eritrea (4.7%, a difference of 0.18%), Immigrants from Bosnia and Herzegovina (4.7%, a difference of 0.20%), Venezuelan (4.7%, a difference of 0.43%), Bulgarian (4.7%, a difference of 0.49%), and Tongan (4.8%, a difference of 0.67%).
| Demographics | Rating | Rank | Unemployment Among Ages 30 to 34 years |
| Immigrants | India | 100.0 /100 | #1 | Exceptional 4.5% |
| Sudanese | 100.0 /100 | #2 | Exceptional 4.6% |
| Immigrants | Venezuela | 100.0 /100 | #3 | Exceptional 4.6% |
| Immigrants | Nepal | 100.0 /100 | #4 | Exceptional 4.7% |
| Venezuelans | 100.0 /100 | #5 | Exceptional 4.7% |
| Immigrants | Bosnia and Herzegovina | 100.0 /100 | #6 | Exceptional 4.7% |
| Thais | 100.0 /100 | #7 | Exceptional 4.7% |
| Immigrants | Eritrea | 100.0 /100 | #8 | Exceptional 4.7% |
| Bulgarians | 99.9 /100 | #9 | Exceptional 4.7% |
| Tongans | 99.9 /100 | #10 | Exceptional 4.8% |
| Immigrants | Bolivia | 99.9 /100 | #11 | Exceptional 4.8% |
| Filipinos | 99.9 /100 | #12 | Exceptional 4.8% |
| Cambodians | 99.9 /100 | #13 | Exceptional 4.8% |
| Luxembourgers | 99.9 /100 | #14 | Exceptional 4.8% |
| Okinawans | 99.9 /100 | #15 | Exceptional 4.8% |