Puerto Rican vs Immigrants from Latvia In Labor Force | Age 20-24
COMPARE
Puerto Rican
Immigrants from Latvia
In Labor Force | Age 20-24
In Labor Force | Age 20-24 Comparison
Puerto Ricans
Immigrants from Latvia
68.3%
IN LABOR FORCE | AGE 20-24
0.0/ 100
METRIC RATING
343rd/ 347
METRIC RANK
75.0%
IN LABOR FORCE | AGE 20-24
44.1/ 100
METRIC RATING
179th/ 347
METRIC RANK
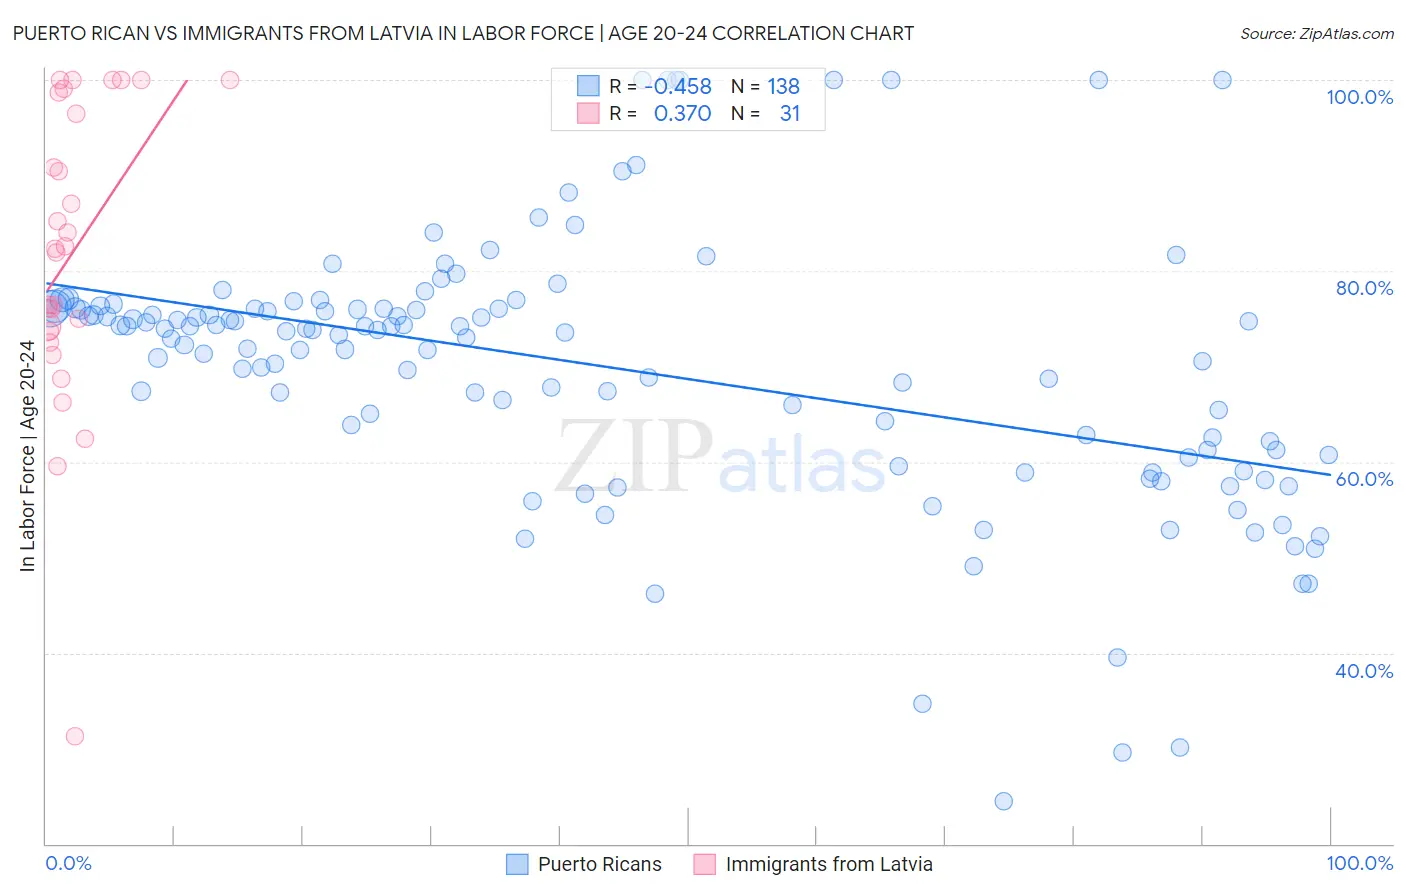
Puerto Rican vs Immigrants from Latvia In Labor Force | Age 20-24 Correlation Chart
The statistical analysis conducted on geographies consisting of 527,810,286 people shows a moderate negative correlation between the proportion of Puerto Ricans and labor force participation rate among population between the ages 20 and 24 in the United States with a correlation coefficient (R) of -0.458 and weighted average of 68.3%. Similarly, the statistical analysis conducted on geographies consisting of 113,730,913 people shows a mild positive correlation between the proportion of Immigrants from Latvia and labor force participation rate among population between the ages 20 and 24 in the United States with a correlation coefficient (R) of 0.370 and weighted average of 75.0%, a difference of 9.8%.
In Labor Force | Age 20-24 Correlation Summary
| Measurement | Puerto Rican | Immigrants from Latvia |
| Minimum | 24.4% | 31.2% |
| Maximum | 100.0% | 100.0% |
| Range | 75.6% | 68.8% |
| Mean | 69.9% | 81.9% |
| Median | 73.6% | 82.3% |
| Interquartile 25% (IQ1) | 61.2% | 73.7% |
| Interquartile 75% (IQ3) | 76.1% | 98.7% |
| Interquartile Range (IQR) | 14.9% | 25.0% |
| Standard Deviation (Sample) | 13.9% | 15.6% |
| Standard Deviation (Population) | 13.9% | 15.4% |
Similar Demographics by In Labor Force | Age 20-24
Demographics Similar to Puerto Ricans by In Labor Force | Age 20-24
In terms of in labor force | age 20-24, the demographic groups most similar to Puerto Ricans are Immigrants from St. Vincent and the Grenadines (68.4%, a difference of 0.12%), Tohono O'odham (68.6%, a difference of 0.43%), Menominee (68.7%, a difference of 0.56%), Immigrants from Yemen (68.9%, a difference of 0.87%), and Pima (69.0%, a difference of 1.0%).
| Demographics | Rating | Rank | In Labor Force | Age 20-24 |
| Yuman | 0.0 /100 | #333 | Tragic 70.3% |
| British West Indians | 0.0 /100 | #334 | Tragic 70.0% |
| Immigrants | Barbados | 0.0 /100 | #335 | Tragic 69.7% |
| Immigrants | Guyana | 0.0 /100 | #336 | Tragic 69.3% |
| Guyanese | 0.0 /100 | #337 | Tragic 69.2% |
| Pima | 0.0 /100 | #338 | Tragic 69.0% |
| Immigrants | Yemen | 0.0 /100 | #339 | Tragic 68.9% |
| Menominee | 0.0 /100 | #340 | Tragic 68.7% |
| Tohono O'odham | 0.0 /100 | #341 | Tragic 68.6% |
| Immigrants | St. Vincent and the Grenadines | 0.0 /100 | #342 | Tragic 68.4% |
| Puerto Ricans | 0.0 /100 | #343 | Tragic 68.3% |
| Immigrants | Grenada | 0.0 /100 | #344 | Tragic 67.2% |
| Hopi | 0.0 /100 | #345 | Tragic 66.0% |
| Lumbee | 0.0 /100 | #346 | Tragic 65.5% |
| Navajo | 0.0 /100 | #347 | Tragic 64.8% |
Demographics Similar to Immigrants from Latvia by In Labor Force | Age 20-24
In terms of in labor force | age 20-24, the demographic groups most similar to Immigrants from Latvia are Immigrants from Czechoslovakia (75.0%, a difference of 0.0%), Immigrants from Central America (75.0%, a difference of 0.010%), African (75.0%, a difference of 0.020%), Immigrants from Mexico (75.0%, a difference of 0.060%), and Central American (75.0%, a difference of 0.070%).
| Demographics | Rating | Rank | In Labor Force | Age 20-24 |
| Yakama | 50.8 /100 | #172 | Average 75.1% |
| Immigrants | Croatia | 50.2 /100 | #173 | Average 75.1% |
| South Africans | 50.0 /100 | #174 | Average 75.0% |
| Syrians | 49.5 /100 | #175 | Average 75.0% |
| Central Americans | 48.7 /100 | #176 | Average 75.0% |
| Immigrants | Mexico | 47.8 /100 | #177 | Average 75.0% |
| Immigrants | Central America | 45.0 /100 | #178 | Average 75.0% |
| Immigrants | Latvia | 44.1 /100 | #179 | Average 75.0% |
| Immigrants | Czechoslovakia | 44.0 /100 | #180 | Average 75.0% |
| Africans | 42.5 /100 | #181 | Average 75.0% |
| Immigrants | South Africa | 36.9 /100 | #182 | Fair 74.9% |
| Immigrants | Costa Rica | 36.7 /100 | #183 | Fair 74.9% |
| Immigrants | Hungary | 35.0 /100 | #184 | Fair 74.9% |
| Sri Lankans | 34.9 /100 | #185 | Fair 74.9% |
| Immigrants | Eastern Europe | 33.8 /100 | #186 | Fair 74.9% |