Puerto Rican vs Immigrants from Dominica Kindergarten
COMPARE
Puerto Rican
Immigrants from Dominica
Kindergarten
Kindergarten Comparison
Puerto Ricans
Immigrants from Dominica
97.7%
KINDERGARTEN
2.7/ 100
METRIC RATING
231st/ 347
METRIC RANK
97.1%
KINDERGARTEN
0.0/ 100
METRIC RATING
298th/ 347
METRIC RANK
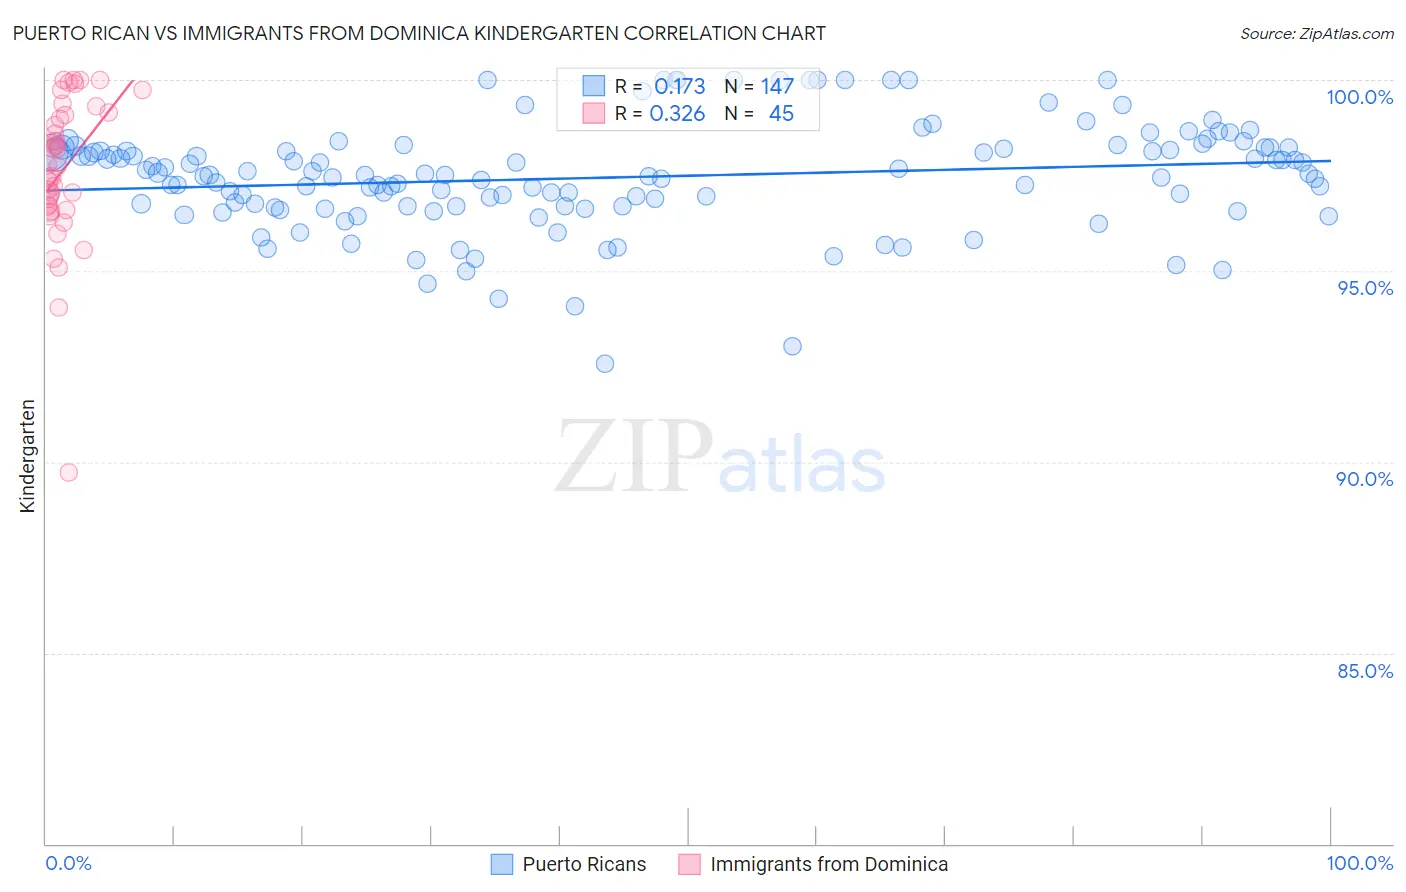
Puerto Rican vs Immigrants from Dominica Kindergarten Correlation Chart
The statistical analysis conducted on geographies consisting of 528,320,522 people shows a poor positive correlation between the proportion of Puerto Ricans and percentage of population with at least kindergarten education in the United States with a correlation coefficient (R) of 0.173 and weighted average of 97.7%. Similarly, the statistical analysis conducted on geographies consisting of 83,794,115 people shows a mild positive correlation between the proportion of Immigrants from Dominica and percentage of population with at least kindergarten education in the United States with a correlation coefficient (R) of 0.326 and weighted average of 97.1%, a difference of 0.56%.
Kindergarten Correlation Summary
| Measurement | Puerto Rican | Immigrants from Dominica |
| Minimum | 92.6% | 89.7% |
| Maximum | 100.0% | 100.0% |
| Range | 7.4% | 10.3% |
| Mean | 97.5% | 97.6% |
| Median | 97.5% | 97.7% |
| Interquartile 25% (IQ1) | 96.7% | 96.7% |
| Interquartile 75% (IQ3) | 98.2% | 99.1% |
| Interquartile Range (IQR) | 1.5% | 2.5% |
| Standard Deviation (Sample) | 1.4% | 1.9% |
| Standard Deviation (Population) | 1.4% | 1.9% |
Similar Demographics by Kindergarten
Demographics Similar to Puerto Ricans by Kindergarten
In terms of kindergarten, the demographic groups most similar to Puerto Ricans are Immigrants from Uruguay (97.7%, a difference of 0.010%), Sudanese (97.7%, a difference of 0.020%), Immigrants from Costa Rica (97.7%, a difference of 0.020%), Subsaharan African (97.7%, a difference of 0.020%), and Sierra Leonean (97.7%, a difference of 0.020%).
| Demographics | Rating | Rank | Kindergarten |
| Iraqis | 3.9 /100 | #224 | Tragic 97.7% |
| Immigrants | Nepal | 3.8 /100 | #225 | Tragic 97.7% |
| Sudanese | 3.7 /100 | #226 | Tragic 97.7% |
| Immigrants | Costa Rica | 3.6 /100 | #227 | Tragic 97.7% |
| Sub-Saharan Africans | 3.5 /100 | #228 | Tragic 97.7% |
| Sierra Leoneans | 3.4 /100 | #229 | Tragic 97.7% |
| Senegalese | 3.3 /100 | #230 | Tragic 97.7% |
| Puerto Ricans | 2.7 /100 | #231 | Tragic 97.7% |
| Immigrants | Uruguay | 2.6 /100 | #232 | Tragic 97.7% |
| Immigrants | Pakistan | 2.2 /100 | #233 | Tragic 97.7% |
| Immigrants | Malaysia | 2.2 /100 | #234 | Tragic 97.7% |
| Colombians | 2.2 /100 | #235 | Tragic 97.7% |
| Immigrants | Western Asia | 2.1 /100 | #236 | Tragic 97.7% |
| Nigerians | 1.8 /100 | #237 | Tragic 97.6% |
| Immigrants | Eastern Asia | 1.7 /100 | #238 | Tragic 97.6% |
Demographics Similar to Immigrants from Dominica by Kindergarten
In terms of kindergarten, the demographic groups most similar to Immigrants from Dominica are Immigrants from Cuba (97.1%, a difference of 0.010%), Central American Indian (97.2%, a difference of 0.020%), Haitian (97.1%, a difference of 0.020%), Immigrants from South Eastern Asia (97.1%, a difference of 0.040%), and Immigrants from Caribbean (97.1%, a difference of 0.060%).
| Demographics | Rating | Rank | Kindergarten |
| Houma | 0.0 /100 | #291 | Tragic 97.3% |
| British West Indians | 0.0 /100 | #292 | Tragic 97.3% |
| Malaysians | 0.0 /100 | #293 | Tragic 97.2% |
| Immigrants | Immigrants | 0.0 /100 | #294 | Tragic 97.2% |
| Immigrants | Grenada | 0.0 /100 | #295 | Tragic 97.2% |
| Immigrants | Eritrea | 0.0 /100 | #296 | Tragic 97.2% |
| Central American Indians | 0.0 /100 | #297 | Tragic 97.2% |
| Immigrants | Dominica | 0.0 /100 | #298 | Tragic 97.1% |
| Immigrants | Cuba | 0.0 /100 | #299 | Tragic 97.1% |
| Haitians | 0.0 /100 | #300 | Tragic 97.1% |
| Immigrants | South Eastern Asia | 0.0 /100 | #301 | Tragic 97.1% |
| Immigrants | Caribbean | 0.0 /100 | #302 | Tragic 97.1% |
| Somalis | 0.0 /100 | #303 | Tragic 97.0% |
| Nicaraguans | 0.0 /100 | #304 | Tragic 97.0% |
| Ecuadorians | 0.0 /100 | #305 | Tragic 97.0% |