Puerto Rican vs Immigrants from Dominica 12th Grade, No Diploma
COMPARE
Puerto Rican
Immigrants from Dominica
12th Grade, No Diploma
12th Grade, No Diploma Comparison
Puerto Ricans
Immigrants from Dominica
86.5%
12TH GRADE, NO DIPLOMA
0.0/ 100
METRIC RATING
321st/ 347
METRIC RANK
87.7%
12TH GRADE, NO DIPLOMA
0.0/ 100
METRIC RATING
305th/ 347
METRIC RANK
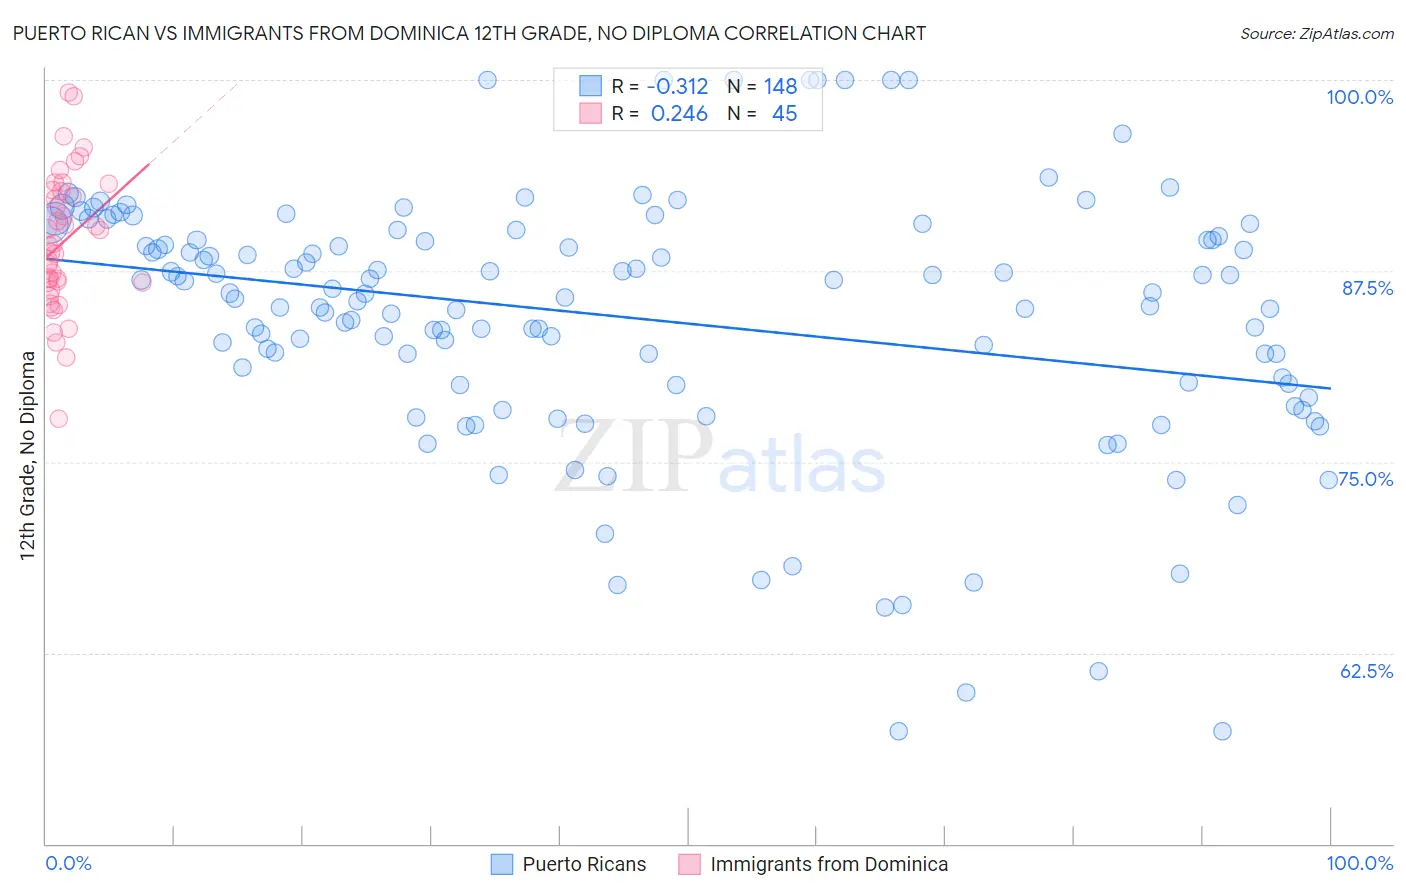
Puerto Rican vs Immigrants from Dominica 12th Grade, No Diploma Correlation Chart
The statistical analysis conducted on geographies consisting of 528,321,878 people shows a mild negative correlation between the proportion of Puerto Ricans and percentage of population with at least 12th grade (no diploma) education in the United States with a correlation coefficient (R) of -0.312 and weighted average of 86.5%. Similarly, the statistical analysis conducted on geographies consisting of 83,794,115 people shows a weak positive correlation between the proportion of Immigrants from Dominica and percentage of population with at least 12th grade (no diploma) education in the United States with a correlation coefficient (R) of 0.246 and weighted average of 87.7%, a difference of 1.4%.
12th Grade, No Diploma Correlation Summary
| Measurement | Puerto Rican | Immigrants from Dominica |
| Minimum | 57.4% | 77.8% |
| Maximum | 100.0% | 99.2% |
| Range | 42.6% | 21.4% |
| Mean | 84.5% | 89.4% |
| Median | 86.0% | 89.2% |
| Interquartile 25% (IQ1) | 80.2% | 86.5% |
| Interquartile 75% (IQ3) | 89.6% | 92.8% |
| Interquartile Range (IQR) | 9.5% | 6.2% |
| Standard Deviation (Sample) | 8.5% | 4.5% |
| Standard Deviation (Population) | 8.4% | 4.5% |
Demographics Similar to Puerto Ricans and Immigrants from Dominica by 12th Grade, No Diploma
In terms of 12th grade, no diploma, the demographic groups most similar to Puerto Ricans are Immigrants from Nicaragua (86.6%, a difference of 0.030%), Central American Indian (86.5%, a difference of 0.080%), Yuman (86.5%, a difference of 0.080%), Immigrants from Belize (87.0%, a difference of 0.49%), and Belizean (87.0%, a difference of 0.57%). Similarly, the demographic groups most similar to Immigrants from Dominica are Native/Alaskan (87.7%, a difference of 0.070%), Immigrants from Portugal (87.6%, a difference of 0.11%), Yup'ik (87.6%, a difference of 0.15%), Immigrants from Armenia (87.6%, a difference of 0.18%), and Vietnamese (87.9%, a difference of 0.19%).
| Demographics | Rating | Rank | 12th Grade, No Diploma |
| Immigrants | Bangladesh | 0.0 /100 | #303 | Tragic 88.0% |
| Vietnamese | 0.0 /100 | #304 | Tragic 87.9% |
| Immigrants | Dominica | 0.0 /100 | #305 | Tragic 87.7% |
| Natives/Alaskans | 0.0 /100 | #306 | Tragic 87.7% |
| Immigrants | Portugal | 0.0 /100 | #307 | Tragic 87.6% |
| Yup'ik | 0.0 /100 | #308 | Tragic 87.6% |
| Immigrants | Armenia | 0.0 /100 | #309 | Tragic 87.6% |
| Immigrants | Cuba | 0.0 /100 | #310 | Tragic 87.5% |
| Yaqui | 0.0 /100 | #311 | Tragic 87.5% |
| Immigrants | Ecuador | 0.0 /100 | #312 | Tragic 87.5% |
| Immigrants | Caribbean | 0.0 /100 | #313 | Tragic 87.4% |
| Cape Verdeans | 0.0 /100 | #314 | Tragic 87.4% |
| Nicaraguans | 0.0 /100 | #315 | Tragic 87.3% |
| Apache | 0.0 /100 | #316 | Tragic 87.3% |
| Navajo | 0.0 /100 | #317 | Tragic 87.1% |
| Belizeans | 0.0 /100 | #318 | Tragic 87.0% |
| Immigrants | Belize | 0.0 /100 | #319 | Tragic 87.0% |
| Immigrants | Nicaragua | 0.0 /100 | #320 | Tragic 86.6% |
| Puerto Ricans | 0.0 /100 | #321 | Tragic 86.5% |
| Central American Indians | 0.0 /100 | #322 | Tragic 86.5% |
| Yuman | 0.0 /100 | #323 | Tragic 86.5% |