Pueblo vs Immigrants from Belize 7th Grade
COMPARE
Pueblo
Immigrants from Belize
7th Grade
7th Grade Comparison
Pueblo
Immigrants from Belize
96.5%
7TH GRADE
96.8/ 100
METRIC RATING
113th/ 347
METRIC RANK
93.4%
7TH GRADE
0.0/ 100
METRIC RATING
323rd/ 347
METRIC RANK
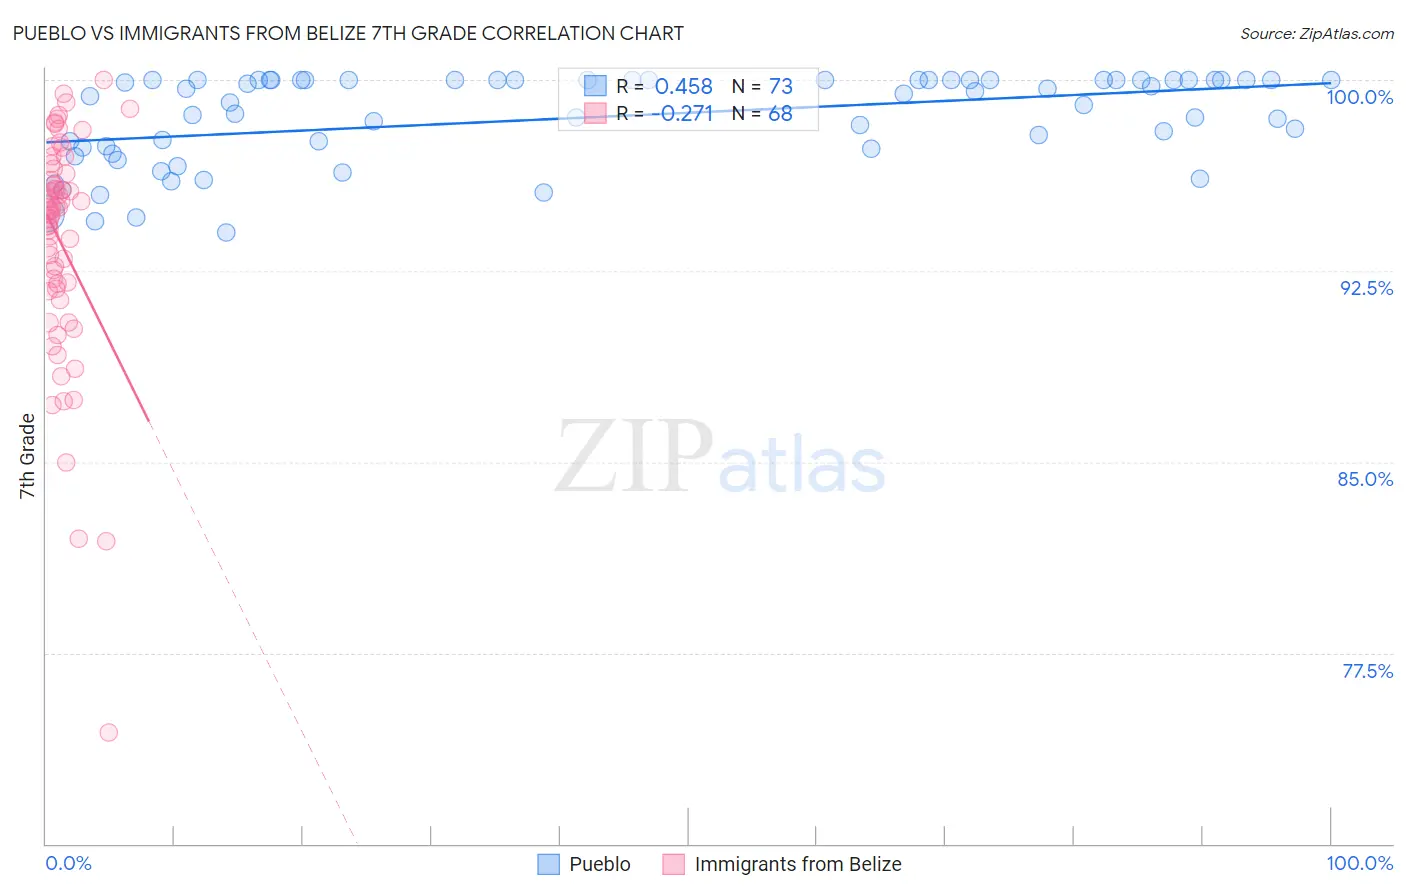
Pueblo vs Immigrants from Belize 7th Grade Correlation Chart
The statistical analysis conducted on geographies consisting of 120,086,078 people shows a moderate positive correlation between the proportion of Pueblo and percentage of population with at least 7th grade education in the United States with a correlation coefficient (R) of 0.458 and weighted average of 96.5%. Similarly, the statistical analysis conducted on geographies consisting of 130,181,087 people shows a weak negative correlation between the proportion of Immigrants from Belize and percentage of population with at least 7th grade education in the United States with a correlation coefficient (R) of -0.271 and weighted average of 93.4%, a difference of 3.4%.
7th Grade Correlation Summary
| Measurement | Pueblo | Immigrants from Belize |
| Minimum | 94.0% | 74.3% |
| Maximum | 100.0% | 100.0% |
| Range | 6.0% | 25.7% |
| Mean | 98.5% | 93.6% |
| Median | 99.5% | 94.9% |
| Interquartile 25% (IQ1) | 97.3% | 91.8% |
| Interquartile 75% (IQ3) | 100.0% | 96.4% |
| Interquartile Range (IQR) | 2.7% | 4.7% |
| Standard Deviation (Sample) | 1.8% | 4.6% |
| Standard Deviation (Population) | 1.7% | 4.5% |
Similar Demographics by 7th Grade
Demographics Similar to Pueblo by 7th Grade
In terms of 7th grade, the demographic groups most similar to Pueblo are Nonimmigrants (96.5%, a difference of 0.010%), Immigrants from Zimbabwe (96.5%, a difference of 0.010%), Choctaw (96.5%, a difference of 0.010%), Syrian (96.5%, a difference of 0.010%), and Okinawan (96.6%, a difference of 0.030%).
| Demographics | Rating | Rank | 7th Grade |
| Iroquois | 97.9 /100 | #106 | Exceptional 96.6% |
| Lumbee | 97.8 /100 | #107 | Exceptional 96.6% |
| Immigrants | Saudi Arabia | 97.8 /100 | #108 | Exceptional 96.6% |
| Bhutanese | 97.7 /100 | #109 | Exceptional 96.6% |
| Okinawans | 97.4 /100 | #110 | Exceptional 96.6% |
| Immigrants | Latvia | 97.4 /100 | #111 | Exceptional 96.6% |
| Immigrants | Nonimmigrants | 97.0 /100 | #112 | Exceptional 96.5% |
| Pueblo | 96.8 /100 | #113 | Exceptional 96.5% |
| Immigrants | Zimbabwe | 96.6 /100 | #114 | Exceptional 96.5% |
| Choctaw | 96.6 /100 | #115 | Exceptional 96.5% |
| Syrians | 96.6 /100 | #116 | Exceptional 96.5% |
| Immigrants | Moldova | 95.7 /100 | #117 | Exceptional 96.5% |
| Immigrants | Japan | 95.5 /100 | #118 | Exceptional 96.5% |
| Immigrants | Norway | 95.2 /100 | #119 | Exceptional 96.5% |
| Immigrants | Croatia | 95.0 /100 | #120 | Exceptional 96.5% |
Demographics Similar to Immigrants from Belize by 7th Grade
In terms of 7th grade, the demographic groups most similar to Immigrants from Belize are Dominican (93.3%, a difference of 0.020%), Central American Indian (93.3%, a difference of 0.080%), Nicaraguan (93.5%, a difference of 0.11%), Belizean (93.5%, a difference of 0.15%), and Immigrants from Fiji (93.5%, a difference of 0.19%).
| Demographics | Rating | Rank | 7th Grade |
| Immigrants | Vietnam | 0.0 /100 | #316 | Tragic 93.9% |
| Immigrants | Cuba | 0.0 /100 | #317 | Tragic 93.8% |
| Immigrants | Ecuador | 0.0 /100 | #318 | Tragic 93.7% |
| Immigrants | Cambodia | 0.0 /100 | #319 | Tragic 93.7% |
| Immigrants | Fiji | 0.0 /100 | #320 | Tragic 93.5% |
| Belizeans | 0.0 /100 | #321 | Tragic 93.5% |
| Nicaraguans | 0.0 /100 | #322 | Tragic 93.5% |
| Immigrants | Belize | 0.0 /100 | #323 | Tragic 93.4% |
| Dominicans | 0.0 /100 | #324 | Tragic 93.3% |
| Central American Indians | 0.0 /100 | #325 | Tragic 93.3% |
| Nepalese | 0.0 /100 | #326 | Tragic 93.2% |
| Immigrants | Cabo Verde | 0.0 /100 | #327 | Tragic 93.1% |
| Immigrants | Nicaragua | 0.0 /100 | #328 | Tragic 93.0% |
| Immigrants | Azores | 0.0 /100 | #329 | Tragic 93.0% |
| Immigrants | Dominican Republic | 0.0 /100 | #330 | Tragic 92.9% |