Pueblo vs Immigrants from Belize No Schooling Completed
COMPARE
Pueblo
Immigrants from Belize
No Schooling Completed
No Schooling Completed Comparison
Pueblo
Immigrants from Belize
1.9%
NO SCHOOLING COMPLETED
96.4/ 100
METRIC RATING
112th/ 347
METRIC RANK
3.1%
NO SCHOOLING COMPLETED
0.0/ 100
METRIC RATING
314th/ 347
METRIC RANK
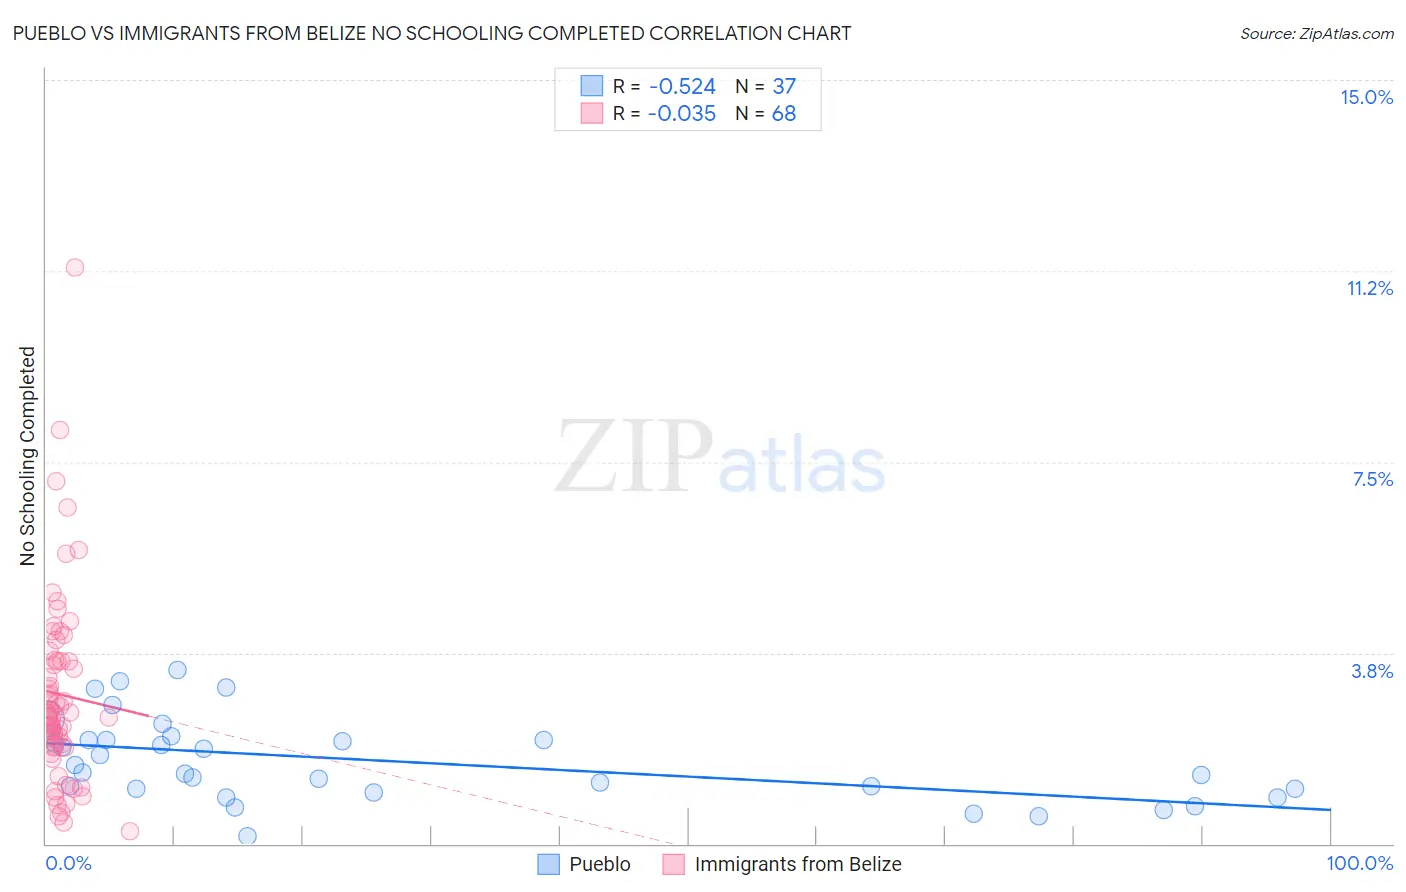
Pueblo vs Immigrants from Belize No Schooling Completed Correlation Chart
The statistical analysis conducted on geographies consisting of 119,717,699 people shows a substantial negative correlation between the proportion of Pueblo and percentage of population with no schooling in the United States with a correlation coefficient (R) of -0.524 and weighted average of 1.9%. Similarly, the statistical analysis conducted on geographies consisting of 130,082,075 people shows no correlation between the proportion of Immigrants from Belize and percentage of population with no schooling in the United States with a correlation coefficient (R) of -0.035 and weighted average of 3.1%, a difference of 64.8%.
No Schooling Completed Correlation Summary
| Measurement | Pueblo | Immigrants from Belize |
| Minimum | 0.16% | 0.25% |
| Maximum | 3.4% | 11.3% |
| Range | 3.2% | 11.1% |
| Mean | 1.6% | 2.9% |
| Median | 1.4% | 2.5% |
| Interquartile 25% (IQ1) | 1.0% | 1.9% |
| Interquartile 75% (IQ3) | 2.0% | 3.6% |
| Interquartile Range (IQR) | 1.00% | 1.7% |
| Standard Deviation (Sample) | 0.81% | 1.9% |
| Standard Deviation (Population) | 0.80% | 1.9% |
Similar Demographics by No Schooling Completed
Demographics Similar to Pueblo by No Schooling Completed
In terms of no schooling completed, the demographic groups most similar to Pueblo are Immigrants from Japan (1.9%, a difference of 0.19%), Immigrants from Zimbabwe (1.9%, a difference of 0.25%), Immigrants from Norway (1.9%, a difference of 0.25%), Immigrants from Latvia (1.9%, a difference of 0.33%), and Syrian (1.9%, a difference of 0.38%).
| Demographics | Rating | Rank | No Schooling Completed |
| German Russians | 97.5 /100 | #105 | Exceptional 1.8% |
| Immigrants | France | 97.3 /100 | #106 | Exceptional 1.8% |
| Yugoslavians | 97.2 /100 | #107 | Exceptional 1.8% |
| Okinawans | 97.1 /100 | #108 | Exceptional 1.8% |
| Immigrants | Saudi Arabia | 96.8 /100 | #109 | Exceptional 1.9% |
| Immigrants | Latvia | 96.7 /100 | #110 | Exceptional 1.9% |
| Immigrants | Japan | 96.6 /100 | #111 | Exceptional 1.9% |
| Pueblo | 96.4 /100 | #112 | Exceptional 1.9% |
| Immigrants | Zimbabwe | 96.2 /100 | #113 | Exceptional 1.9% |
| Immigrants | Norway | 96.1 /100 | #114 | Exceptional 1.9% |
| Syrians | 96.0 /100 | #115 | Exceptional 1.9% |
| Lebanese | 96.0 /100 | #116 | Exceptional 1.9% |
| Immigrants | Serbia | 95.8 /100 | #117 | Exceptional 1.9% |
| Spanish | 95.5 /100 | #118 | Exceptional 1.9% |
| Iroquois | 95.1 /100 | #119 | Exceptional 1.9% |
Demographics Similar to Immigrants from Belize by No Schooling Completed
In terms of no schooling completed, the demographic groups most similar to Immigrants from Belize are Honduran (3.1%, a difference of 0.090%), Immigrants from Nicaragua (3.1%, a difference of 0.24%), Sri Lankan (3.0%, a difference of 0.60%), Immigrants from Ecuador (3.1%, a difference of 0.60%), and Immigrants from the Azores (3.0%, a difference of 0.88%).
| Demographics | Rating | Rank | No Schooling Completed |
| Immigrants | Haiti | 0.0 /100 | #307 | Tragic 3.0% |
| Immigrants | Somalia | 0.0 /100 | #308 | Tragic 3.0% |
| Hispanics or Latinos | 0.0 /100 | #309 | Tragic 3.0% |
| Guyanese | 0.0 /100 | #310 | Tragic 3.0% |
| Immigrants | Azores | 0.0 /100 | #311 | Tragic 3.0% |
| Sri Lankans | 0.0 /100 | #312 | Tragic 3.0% |
| Hondurans | 0.0 /100 | #313 | Tragic 3.1% |
| Immigrants | Belize | 0.0 /100 | #314 | Tragic 3.1% |
| Immigrants | Nicaragua | 0.0 /100 | #315 | Tragic 3.1% |
| Immigrants | Ecuador | 0.0 /100 | #316 | Tragic 3.1% |
| Cape Verdeans | 0.0 /100 | #317 | Tragic 3.1% |
| Immigrants | Guyana | 0.0 /100 | #318 | Tragic 3.1% |
| Immigrants | Burma/Myanmar | 0.0 /100 | #319 | Tragic 3.1% |
| Immigrants | Bangladesh | 0.0 /100 | #320 | Tragic 3.1% |
| Immigrants | Laos | 0.0 /100 | #321 | Tragic 3.1% |