Aleut vs Immigrants from Belize In Labor Force | Age 20-64
COMPARE
Aleut
Immigrants from Belize
In Labor Force | Age 20-64
In Labor Force | Age 20-64 Comparison
Aleuts
Immigrants from Belize
78.2%
IN LABOR FORCE | AGE 20-64
0.0/ 100
METRIC RATING
274th/ 347
METRIC RANK
78.0%
IN LABOR FORCE | AGE 20-64
0.0/ 100
METRIC RATING
286th/ 347
METRIC RANK
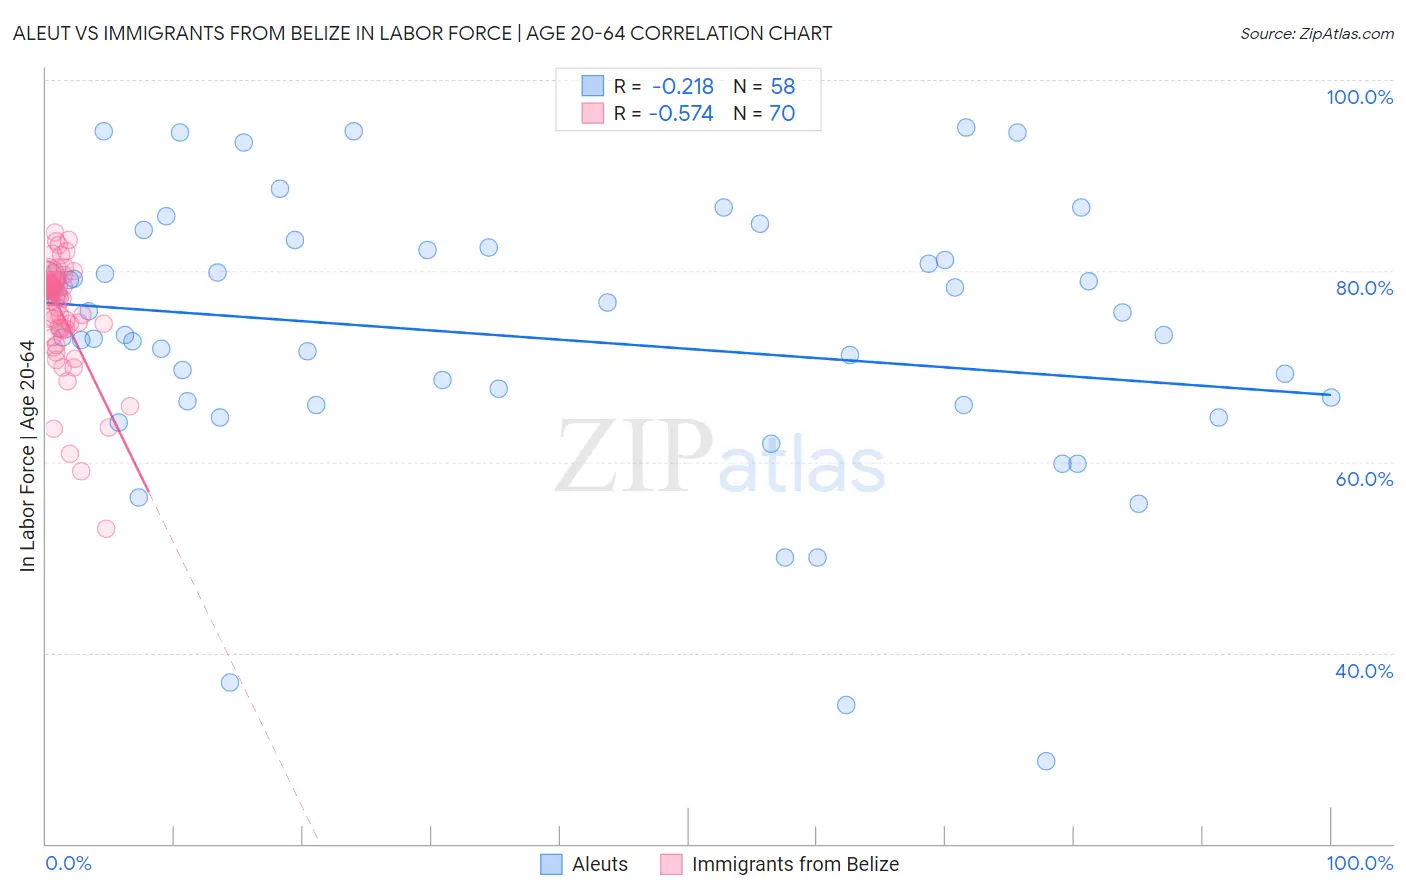
Aleut vs Immigrants from Belize In Labor Force | Age 20-64 Correlation Chart
The statistical analysis conducted on geographies consisting of 61,782,784 people shows a weak negative correlation between the proportion of Aleuts and labor force participation rate among population between the ages 20 and 64 in the United States with a correlation coefficient (R) of -0.218 and weighted average of 78.2%. Similarly, the statistical analysis conducted on geographies consisting of 130,318,427 people shows a substantial negative correlation between the proportion of Immigrants from Belize and labor force participation rate among population between the ages 20 and 64 in the United States with a correlation coefficient (R) of -0.574 and weighted average of 78.0%, a difference of 0.31%.
In Labor Force | Age 20-64 Correlation Summary
| Measurement | Aleut | Immigrants from Belize |
| Minimum | 28.6% | 53.0% |
| Maximum | 95.0% | 84.0% |
| Range | 66.4% | 31.0% |
| Mean | 73.0% | 75.6% |
| Median | 73.3% | 77.3% |
| Interquartile 25% (IQ1) | 66.0% | 73.9% |
| Interquartile 75% (IQ3) | 82.2% | 78.8% |
| Interquartile Range (IQR) | 16.2% | 4.9% |
| Standard Deviation (Sample) | 14.4% | 5.8% |
| Standard Deviation (Population) | 14.3% | 5.7% |
Demographics Similar to Aleuts and Immigrants from Belize by In Labor Force | Age 20-64
In terms of in labor force | age 20-64, the demographic groups most similar to Aleuts are Spanish (78.2%, a difference of 0.010%), Puget Sound Salish (78.2%, a difference of 0.010%), French American Indian (78.2%, a difference of 0.020%), Immigrants from Bahamas (78.2%, a difference of 0.020%), and Mexican American Indian (78.2%, a difference of 0.030%). Similarly, the demographic groups most similar to Immigrants from Belize are Vietnamese (78.0%, a difference of 0.0%), Osage (78.0%, a difference of 0.010%), Hmong (77.9%, a difference of 0.080%), African (77.9%, a difference of 0.090%), and Immigrants from Bangladesh (77.9%, a difference of 0.10%).
| Demographics | Rating | Rank | In Labor Force | Age 20-64 |
| Scotch-Irish | 0.0 /100 | #270 | Tragic 78.3% |
| Immigrants | Latin America | 0.0 /100 | #271 | Tragic 78.3% |
| Marshallese | 0.0 /100 | #272 | Tragic 78.3% |
| French American Indians | 0.0 /100 | #273 | Tragic 78.2% |
| Aleuts | 0.0 /100 | #274 | Tragic 78.2% |
| Spanish | 0.0 /100 | #275 | Tragic 78.2% |
| Puget Sound Salish | 0.0 /100 | #276 | Tragic 78.2% |
| Immigrants | Bahamas | 0.0 /100 | #277 | Tragic 78.2% |
| Mexican American Indians | 0.0 /100 | #278 | Tragic 78.2% |
| Belizeans | 0.0 /100 | #279 | Tragic 78.2% |
| Immigrants | Dominica | 0.0 /100 | #280 | Tragic 78.1% |
| Guyanese | 0.0 /100 | #281 | Tragic 78.1% |
| Immigrants | St. Vincent and the Grenadines | 0.0 /100 | #282 | Tragic 78.1% |
| Immigrants | Nonimmigrants | 0.0 /100 | #283 | Tragic 78.1% |
| Immigrants | Guyana | 0.0 /100 | #284 | Tragic 78.1% |
| Osage | 0.0 /100 | #285 | Tragic 78.0% |
| Immigrants | Belize | 0.0 /100 | #286 | Tragic 78.0% |
| Vietnamese | 0.0 /100 | #287 | Tragic 78.0% |
| Hmong | 0.0 /100 | #288 | Tragic 77.9% |
| Africans | 0.0 /100 | #289 | Tragic 77.9% |
| Immigrants | Bangladesh | 0.0 /100 | #290 | Tragic 77.9% |