Lebanese vs White/Caucasian In Labor Force | Age > 16
COMPARE
Lebanese
White/Caucasian
In Labor Force | Age > 16
In Labor Force | Age > 16 Comparison
Lebanese
Whites/Caucasians
64.5%
IN LABOR FORCE | AGE > 16
3.9/ 100
METRIC RATING
238th/ 347
METRIC RANK
63.6%
IN LABOR FORCE | AGE > 16
0.0/ 100
METRIC RATING
299th/ 347
METRIC RANK
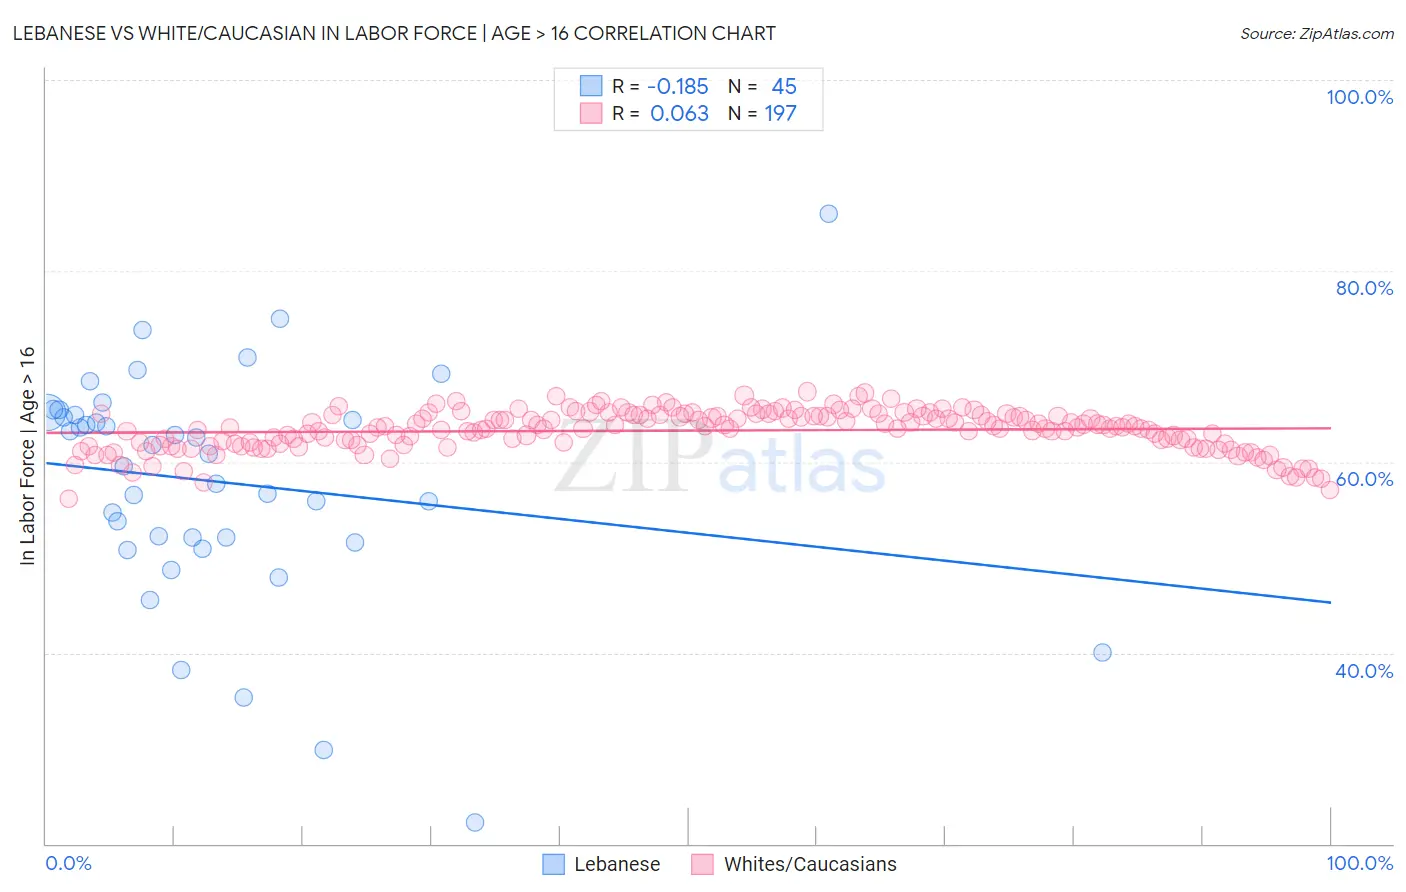
Lebanese vs White/Caucasian In Labor Force | Age > 16 Correlation Chart
The statistical analysis conducted on geographies consisting of 401,629,363 people shows a poor negative correlation between the proportion of Lebanese and labor force participation rate among population ages 16 and over in the United States with a correlation coefficient (R) of -0.185 and weighted average of 64.5%. Similarly, the statistical analysis conducted on geographies consisting of 584,901,305 people shows a slight positive correlation between the proportion of Whites/Caucasians and labor force participation rate among population ages 16 and over in the United States with a correlation coefficient (R) of 0.063 and weighted average of 63.6%, a difference of 1.5%.
In Labor Force | Age > 16 Correlation Summary
| Measurement | Lebanese | White/Caucasian |
| Minimum | 22.2% | 56.1% |
| Maximum | 86.0% | 67.3% |
| Range | 63.8% | 11.3% |
| Mean | 57.9% | 63.3% |
| Median | 60.9% | 63.6% |
| Interquartile 25% (IQ1) | 51.8% | 61.8% |
| Interquartile 75% (IQ3) | 65.0% | 64.9% |
| Interquartile Range (IQR) | 13.2% | 3.1% |
| Standard Deviation (Sample) | 12.1% | 2.1% |
| Standard Deviation (Population) | 11.9% | 2.1% |
Similar Demographics by In Labor Force | Age > 16
Demographics Similar to Lebanese by In Labor Force | Age > 16
In terms of in labor force | age > 16, the demographic groups most similar to Lebanese are Immigrants from Hungary (64.5%, a difference of 0.010%), Immigrants from Bangladesh (64.5%, a difference of 0.030%), Immigrants from Dominica (64.5%, a difference of 0.030%), Immigrants from Netherlands (64.5%, a difference of 0.040%), and Vietnamese (64.6%, a difference of 0.050%).
| Demographics | Rating | Rank | In Labor Force | Age > 16 |
| Immigrants | Northern Europe | 7.2 /100 | #231 | Tragic 64.7% |
| Africans | 5.8 /100 | #232 | Tragic 64.6% |
| Slavs | 4.9 /100 | #233 | Tragic 64.6% |
| Vietnamese | 4.7 /100 | #234 | Tragic 64.6% |
| Austrians | 4.6 /100 | #235 | Tragic 64.6% |
| Immigrants | Norway | 4.6 /100 | #236 | Tragic 64.6% |
| Italians | 4.6 /100 | #237 | Tragic 64.6% |
| Lebanese | 3.9 /100 | #238 | Tragic 64.5% |
| Immigrants | Hungary | 3.8 /100 | #239 | Tragic 64.5% |
| Immigrants | Bangladesh | 3.6 /100 | #240 | Tragic 64.5% |
| Immigrants | Dominica | 3.5 /100 | #241 | Tragic 64.5% |
| Immigrants | Netherlands | 3.4 /100 | #242 | Tragic 64.5% |
| Immigrants | Lebanon | 3.2 /100 | #243 | Tragic 64.5% |
| Tsimshian | 3.1 /100 | #244 | Tragic 64.5% |
| West Indians | 3.0 /100 | #245 | Tragic 64.5% |
Demographics Similar to Whites/Caucasians by In Labor Force | Age > 16
In terms of in labor force | age > 16, the demographic groups most similar to Whites/Caucasians are Immigrants from the Azores (63.6%, a difference of 0.010%), Spanish American (63.6%, a difference of 0.030%), Delaware (63.6%, a difference of 0.050%), Immigrants from Grenada (63.6%, a difference of 0.060%), and Comanche (63.6%, a difference of 0.060%).
| Demographics | Rating | Rank | In Labor Force | Age > 16 |
| Spanish American Indians | 0.1 /100 | #292 | Tragic 63.8% |
| English | 0.1 /100 | #293 | Tragic 63.7% |
| Puget Sound Salish | 0.0 /100 | #294 | Tragic 63.7% |
| Immigrants | Canada | 0.0 /100 | #295 | Tragic 63.7% |
| Immigrants | North America | 0.0 /100 | #296 | Tragic 63.7% |
| Immigrants | Grenada | 0.0 /100 | #297 | Tragic 63.6% |
| Comanche | 0.0 /100 | #298 | Tragic 63.6% |
| Whites/Caucasians | 0.0 /100 | #299 | Tragic 63.6% |
| Immigrants | Azores | 0.0 /100 | #300 | Tragic 63.6% |
| Spanish Americans | 0.0 /100 | #301 | Tragic 63.6% |
| Delaware | 0.0 /100 | #302 | Tragic 63.6% |
| Cree | 0.0 /100 | #303 | Tragic 63.5% |
| Immigrants | Nonimmigrants | 0.0 /100 | #304 | Tragic 63.5% |
| Osage | 0.0 /100 | #305 | Tragic 63.5% |
| Blacks/African Americans | 0.0 /100 | #306 | Tragic 63.4% |