Potawatomi vs White/Caucasian Single Mother Households

COMPARE

Potawatomi
Race
Ancestry
AfghanAfricanAlaska NativeAlaskan AthabascanAlbanianAleutAlsatianAmericanApacheArabArapahoArgentineanArmenianAssyrian/Chaldean/SyriacAustralianAustrianBahamianBangladeshiBarbadianBasqueBelgianBelizeanBermudanBhutaneseBlackfeetBolivianBrazilianBritishBritish West IndianBulgarianBurmeseCajunCambodianCanadianCape VerdeanCarpatho RusynCelticCentral AmericanCentral American IndianCherokeeCheyenneChickasawChileanChineseChippewaChoctawColombianColvilleComancheCosta RicanCreeCreekCroatianCrowCubanCypriotCzechCzechoslovakianDanishDelawareDominicanDutchDutch West IndianEastern EuropeanEcuadorianEgyptianEnglishEstonianEthiopianEuropeanFijianFilipinoFinnishFrenchFrench American IndianFrench CanadianGermanGerman RussianGhanaianGreekGuamanian/ChamorroGuatemalanGuyaneseHaitianHmongHonduranHopiHoumaHungarianIcelanderIndian (Asian)IndonesianInupiatIranianIraqiIrishIroquoisIsraeliItalianJamaicanJapaneseJordanianKenyanKiowaKoreanLaotianLatvianLebaneseLiberianLithuanianLumbeeLuxembourgerMacedonianMalaysianMalteseMarshalleseMenomineeMexicanMexican American IndianMongolianMoroccanNative HawaiianNavajoNepaleseNew ZealanderNicaraguanNigerianNorthern EuropeanNorwegianOkinawanOsageOttawaPaiutePakistaniPalestinianPanamanianParaguayanPennsylvania GermanPeruvianPimaPolishPortuguesePotawatomiPuebloPuerto RicanPuget Sound SalishRomanianRussianSalvadoranSamoanScandinavianScotch-IrishScottishSeminoleSenegaleseSerbianShoshoneSierra LeoneanSiouxSlavicSlovakSloveneSomaliSouth AfricanSouth AmericanSouth American IndianSoviet UnionSpaniardSpanishSpanish AmericanSpanish American IndianSri LankanSubsaharan AfricanSudaneseSwedishSwissSyrianTaiwaneseThaiTlingit-HaidaTohono O'OdhamTonganTrinidadian and TobagonianTsimshianTurkishU.S. Virgin IslanderUgandanUkrainianUruguayanUteVenezuelanVietnameseWelshWest IndianYakamaYaquiYugoslavianYumanYup'ikZimbabwean
Immigration
NonimmigrantsImmigrantsAfghanistanAfricaAlbaniaArgentinaArmeniaAsiaAustraliaAustriaBahamasBangladeshBarbadosBelarusBelgiumBelizeBoliviaBosnia and HerzegovinaBrazilBulgariaBurma/MyanmarCabo VerdeCambodiaCameroonCanadaCaribbeanCentral AmericaChileChinaColombiaCongoCosta RicaCroatiaCubaCzechoslovakiaDenmarkDominicaDominican RepublicEastern AfricaEastern AsiaEastern EuropeEcuadorEgyptEl SalvadorEnglandEritreaEthiopiaEuropeFijiFranceGermanyGhanaGreeceGrenadaGuatemalaGuyanaHaitiHondurasHong KongHungaryIndiaIndonesiaIranIraqIrelandIsraelItalyJamaicaJapanJordanKazakhstanKenyaKoreaKuwaitLaosLatin AmericaLatviaLebanonLiberiaLithuaniaMalaysiaMexicoMicronesiaMiddle AfricaMoldovaMoroccoNepalNetherlandsNicaraguaNigeriaNorth AmericaNorth MacedoniaNorthern AfricaNorthern EuropeNorwayOceaniaPakistanPanamaPeruPhilippinesPolandPortugalRomaniaRussiaSaudi ArabiaScotlandSenegalSerbiaSierra LeoneSingaporeSomaliaSouth AfricaSouth AmericaSouth Central AsiaSouth Eastern AsiaSouthern EuropeSpainSri LankaSt. Vincent and the GrenadinesSudanSwedenSwitzerlandSyriaTaiwanThailandTrinidad and TobagoTurkeyUgandaUkraineUruguayUzbekistanVenezuelaVietnamWest IndiesWestern AfricaWestern AsiaWestern EuropeYemenZaireZimbabweAzores
White/Caucasian
Race
Ancestry
AfghanAfricanAlaska NativeAlaskan AthabascanAlbanianAleutAlsatianAmericanApacheArabArapahoArgentineanArmenianAssyrian/Chaldean/SyriacAustralianAustrianBahamianBangladeshiBarbadianBasqueBelgianBelizeanBermudanBhutaneseBlackfeetBolivianBrazilianBritishBritish West IndianBulgarianBurmeseCajunCambodianCanadianCape VerdeanCarpatho RusynCelticCentral AmericanCentral American IndianCherokeeCheyenneChickasawChileanChineseChippewaChoctawColombianColvilleComancheCosta RicanCreeCreekCroatianCrowCubanCypriotCzechCzechoslovakianDanishDelawareDominicanDutchDutch West IndianEastern EuropeanEcuadorianEgyptianEnglishEstonianEthiopianEuropeanFijianFilipinoFinnishFrenchFrench American IndianFrench CanadianGermanGerman RussianGhanaianGreekGuamanian/ChamorroGuatemalanGuyaneseHaitianHmongHonduranHopiHoumaHungarianIcelanderIndian (Asian)IndonesianInupiatIranianIraqiIrishIroquoisIsraeliItalianJamaicanJapaneseJordanianKenyanKiowaKoreanLaotianLatvianLebaneseLiberianLithuanianLumbeeLuxembourgerMacedonianMalaysianMalteseMarshalleseMenomineeMexicanMexican American IndianMongolianMoroccanNative HawaiianNavajoNepaleseNew ZealanderNicaraguanNigerianNorthern EuropeanNorwegianOkinawanOsageOttawaPaiutePakistaniPalestinianPanamanianParaguayanPennsylvania GermanPeruvianPimaPolishPortuguesePuebloPuerto RicanPuget Sound SalishRomanianRussianSalvadoranSamoanScandinavianScotch-IrishScottishSeminoleSenegaleseSerbianShoshoneSierra LeoneanSiouxSlavicSlovakSloveneSomaliSouth AfricanSouth AmericanSouth American IndianSoviet UnionSpaniardSpanishSpanish AmericanSpanish American IndianSri LankanSubsaharan AfricanSudaneseSwedishSwissSyrianTaiwaneseThaiTlingit-HaidaTohono O'OdhamTonganTrinidadian and TobagonianTsimshianTurkishU.S. Virgin IslanderUgandanUkrainianUruguayanUteVenezuelanVietnameseWelshWest IndianYakamaYaquiYugoslavianYumanYup'ikZimbabwean
Immigration
NonimmigrantsImmigrantsAfghanistanAfricaAlbaniaArgentinaArmeniaAsiaAustraliaAustriaBahamasBangladeshBarbadosBelarusBelgiumBelizeBoliviaBosnia and HerzegovinaBrazilBulgariaBurma/MyanmarCabo VerdeCambodiaCameroonCanadaCaribbeanCentral AmericaChileChinaColombiaCongoCosta RicaCroatiaCubaCzechoslovakiaDenmarkDominicaDominican RepublicEastern AfricaEastern AsiaEastern EuropeEcuadorEgyptEl SalvadorEnglandEritreaEthiopiaEuropeFijiFranceGermanyGhanaGreeceGrenadaGuatemalaGuyanaHaitiHondurasHong KongHungaryIndiaIndonesiaIranIraqIrelandIsraelItalyJamaicaJapanJordanKazakhstanKenyaKoreaKuwaitLaosLatin AmericaLatviaLebanonLiberiaLithuaniaMalaysiaMexicoMicronesiaMiddle AfricaMoldovaMoroccoNepalNetherlandsNicaraguaNigeriaNorth AmericaNorth MacedoniaNorthern AfricaNorthern EuropeNorwayOceaniaPakistanPanamaPeruPhilippinesPolandPortugalRomaniaRussiaSaudi ArabiaScotlandSenegalSerbiaSierra LeoneSingaporeSomaliaSouth AfricaSouth AmericaSouth Central AsiaSouth Eastern AsiaSouthern EuropeSpainSri LankaSt. Vincent and the GrenadinesSudanSwedenSwitzerlandSyriaTaiwanThailandTrinidad and TobagoTurkeyUgandaUkraineUruguayUzbekistanVenezuelaVietnamWest IndiesWestern AfricaWestern AsiaWestern EuropeYemenZaireZimbabweAzores
Single Mother Households
Income
Poverty
Unemployment
Labor Participation
Family Structure
Vehicle Availability
Education Level
Disability

Single Mother Households Comparison

Potawatomi

Whites/Caucasians

Poor
Good
6.6%
SINGLE MOTHER HOUSEHOLDS
15.5/ 100
METRIC RATING
199th/ 347
METRIC RANK
6.1%
SINGLE MOTHER HOUSEHOLDS
76.5/ 100
METRIC RATING
155th/ 347
METRIC RANK

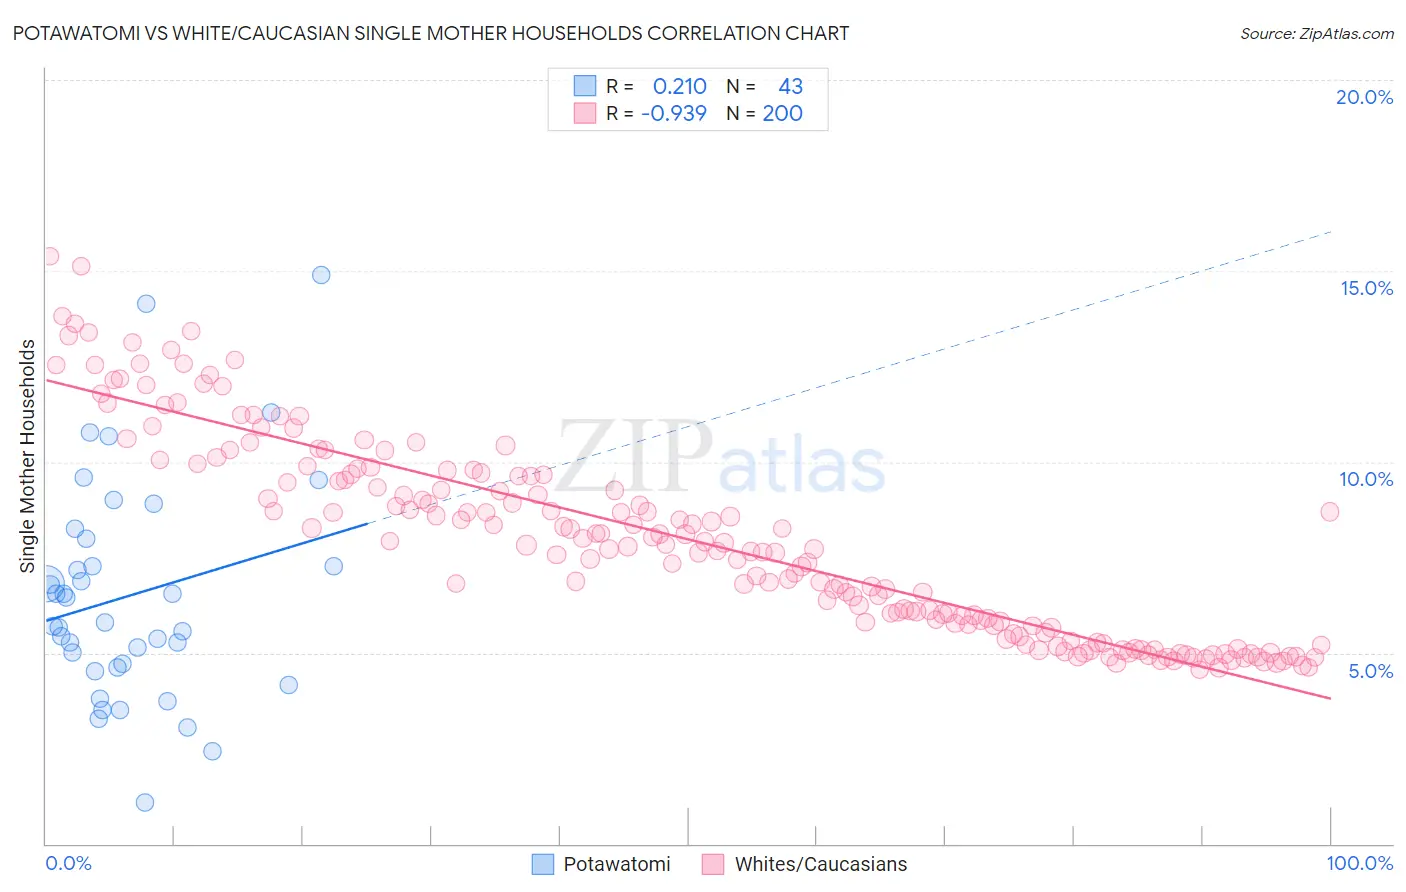
Potawatomi vs White/Caucasian Single Mother Households Correlation Chart

The statistical analysis conducted on geographies consisting of 117,659,768 people shows a weak positive correlation between the proportion of Potawatomi and percentage of single mother households in the United States with a correlation coefficient (R) of 0.210 and weighted average of 6.6%. Similarly, the statistical analysis conducted on geographies consisting of 577,516,213 people shows a near-perfect negative correlation between the proportion of Whites/Caucasians and percentage of single mother households in the United States with a correlation coefficient (R) of -0.939 and weighted average of 6.1%, a difference of 8.1%.
Potawatomi vs White/Caucasian Single Mother Households

Single Mother Households Correlation Summary

MeasurementPotawatomiWhite/Caucasian
Minimum1.1%4.6%
Maximum14.9%15.4%
Range13.8%10.8%
Mean6.5%8.0%
Median5.8%7.8%
Interquartile 25% (IQ1)4.6%5.7%
Interquartile 75% (IQ3)8.0%9.7%
Interquartile Range (IQR)3.4%4.0%
Standard Deviation (Sample)2.9%2.6%
Standard Deviation (Population)2.9%2.6%

Similar Demographics by Single Mother Households

Demographics Similar to Potawatomi by Single Mother Households

In terms of single mother households, the demographic groups most similar to Potawatomi are Hawaiian (6.6%, a difference of 0.11%), Immigrants from Ethiopia (6.6%, a difference of 0.16%), Moroccan (6.6%, a difference of 0.36%), South American (6.6%, a difference of 0.47%), and Uruguayan (6.6%, a difference of 0.47%).
DemographicsRating | RankSingle Mother Households
Americans
19.0
/100
|
#192
Poor
6.6%
Colombians
18.3
/100
|
#193
Poor
6.6%
Immigrants | Uganda
18.3
/100
|
#194
Poor
6.6%
South Americans
18.0
/100
|
#195
Poor
6.6%
Uruguayans
18.0
/100
|
#196
Poor
6.6%
Moroccans
17.4
/100
|
#197
Poor
6.6%
Hawaiians
16.1
/100
|
#198
Poor
6.6%
Potawatomi
15.5
/100
|
#199
Poor
6.6%
Immigrants | Ethiopia
14.7
/100
|
#200
Poor
6.6%
Venezuelans
12.9
/100
|
#201
Poor
6.6%
Guamanians/Chamorros
12.4
/100
|
#202
Poor
6.6%
Immigrants | Peru
12.0
/100
|
#203
Poor
6.7%
Immigrants | Fiji
11.9
/100
|
#204
Poor
6.7%
Cree
11.9
/100
|
#205
Poor
6.7%
German Russians
11.5
/100
|
#206
Poor
6.7%

Demographics Similar to Whites/Caucasians by Single Mother Households

In terms of single mother households, the demographic groups most similar to Whites/Caucasians are Native Hawaiian (6.1%, a difference of 0.23%), Immigrants from Philippines (6.1%, a difference of 0.33%), Chilean (6.1%, a difference of 0.34%), Immigrants from Brazil (6.1%, a difference of 0.40%), and Pakistani (6.1%, a difference of 0.44%).
DemographicsRating | RankSingle Mother Households
Scotch-Irish
82.0
/100
|
#148
Excellent
6.0%
Immigrants | Albania
81.5
/100
|
#149
Excellent
6.1%
Zimbabweans
80.7
/100
|
#150
Excellent
6.1%
Immigrants | Southern Europe
80.5
/100
|
#151
Excellent
6.1%
Pakistanis
79.2
/100
|
#152
Good
6.1%
Immigrants | Brazil
78.9
/100
|
#153
Good
6.1%
Immigrants | Philippines
78.5
/100
|
#154
Good
6.1%
Whites/Caucasians
76.5
/100
|
#155
Good
6.1%
Native Hawaiians
75.0
/100
|
#156
Good
6.1%
Chileans
74.2
/100
|
#157
Good
6.1%
Celtics
73.3
/100
|
#158
Good
6.1%
Yugoslavians
73.1
/100
|
#159
Good
6.1%
Iraqis
73.0
/100
|
#160
Good
6.1%
Immigrants | Germany
72.4
/100
|
#161
Good
6.1%
Immigrants | Zimbabwe
69.9
/100
|
#162
Good
6.2%