Cypriot vs White/Caucasian In Labor Force | Age > 16
COMPARE
Cypriot
White/Caucasian
In Labor Force | Age > 16
In Labor Force | Age > 16 Comparison
Cypriots
Whites/Caucasians
65.5%
IN LABOR FORCE | AGE > 16
88.2/ 100
METRIC RATING
146th/ 347
METRIC RANK
63.6%
IN LABOR FORCE | AGE > 16
0.0/ 100
METRIC RATING
299th/ 347
METRIC RANK
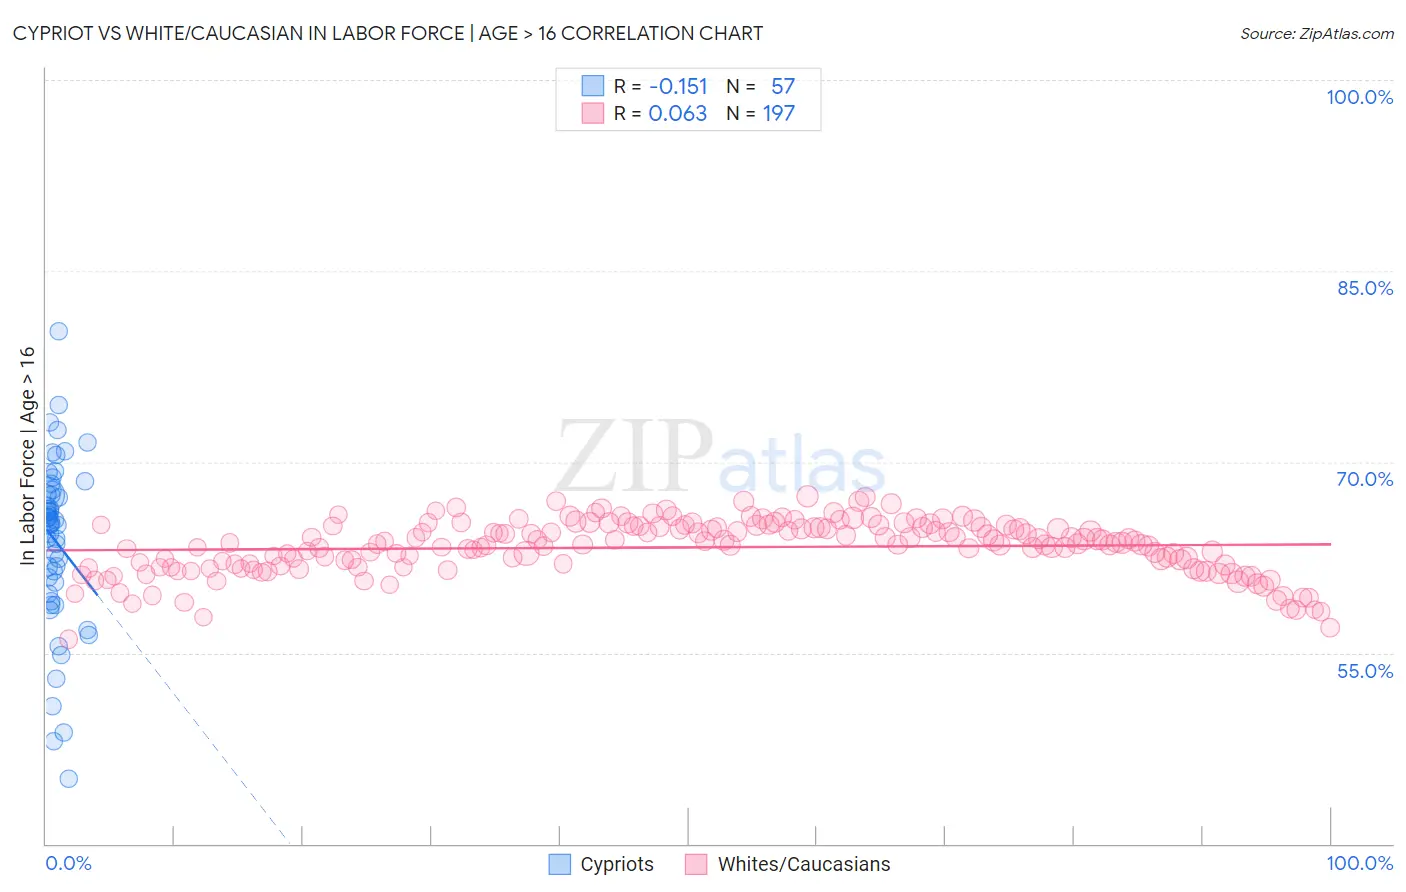
Cypriot vs White/Caucasian In Labor Force | Age > 16 Correlation Chart
The statistical analysis conducted on geographies consisting of 61,870,589 people shows a poor negative correlation between the proportion of Cypriots and labor force participation rate among population ages 16 and over in the United States with a correlation coefficient (R) of -0.151 and weighted average of 65.5%. Similarly, the statistical analysis conducted on geographies consisting of 584,901,305 people shows a slight positive correlation between the proportion of Whites/Caucasians and labor force participation rate among population ages 16 and over in the United States with a correlation coefficient (R) of 0.063 and weighted average of 63.6%, a difference of 3.0%.
In Labor Force | Age > 16 Correlation Summary
| Measurement | Cypriot | White/Caucasian |
| Minimum | 45.1% | 56.1% |
| Maximum | 80.3% | 67.3% |
| Range | 35.2% | 11.3% |
| Mean | 63.8% | 63.3% |
| Median | 65.3% | 63.6% |
| Interquartile 25% (IQ1) | 60.1% | 61.8% |
| Interquartile 75% (IQ3) | 67.6% | 64.9% |
| Interquartile Range (IQR) | 7.6% | 3.1% |
| Standard Deviation (Sample) | 6.7% | 2.1% |
| Standard Deviation (Population) | 6.6% | 2.1% |
Similar Demographics by In Labor Force | Age > 16
Demographics Similar to Cypriots by In Labor Force | Age > 16
In terms of in labor force | age > 16, the demographic groups most similar to Cypriots are Tlingit-Haida (65.5%, a difference of 0.0%), Immigrants from Romania (65.5%, a difference of 0.010%), Immigrants from Oceania (65.5%, a difference of 0.020%), Indian (Asian) (65.5%, a difference of 0.040%), and Latvian (65.5%, a difference of 0.040%).
| Demographics | Rating | Rank | In Labor Force | Age > 16 |
| Immigrants | Taiwan | 90.8 /100 | #139 | Exceptional 65.5% |
| Immigrants | Costa Rica | 90.8 /100 | #140 | Exceptional 65.5% |
| Samoans | 90.5 /100 | #141 | Exceptional 65.5% |
| Indians (Asian) | 89.5 /100 | #142 | Excellent 65.5% |
| Latvians | 89.4 /100 | #143 | Excellent 65.5% |
| Immigrants | Romania | 88.6 /100 | #144 | Excellent 65.5% |
| Tlingit-Haida | 88.3 /100 | #145 | Excellent 65.5% |
| Cypriots | 88.2 /100 | #146 | Excellent 65.5% |
| Immigrants | Oceania | 87.5 /100 | #147 | Excellent 65.5% |
| Bhutanese | 86.3 /100 | #148 | Excellent 65.5% |
| Immigrants | Albania | 85.7 /100 | #149 | Excellent 65.4% |
| Immigrants | Immigrants | 81.9 /100 | #150 | Excellent 65.4% |
| Czechs | 81.5 /100 | #151 | Excellent 65.4% |
| Yugoslavians | 81.3 /100 | #152 | Excellent 65.4% |
| Immigrants | China | 80.5 /100 | #153 | Excellent 65.4% |
Demographics Similar to Whites/Caucasians by In Labor Force | Age > 16
In terms of in labor force | age > 16, the demographic groups most similar to Whites/Caucasians are Immigrants from the Azores (63.6%, a difference of 0.010%), Spanish American (63.6%, a difference of 0.030%), Delaware (63.6%, a difference of 0.050%), Immigrants from Grenada (63.6%, a difference of 0.060%), and Comanche (63.6%, a difference of 0.060%).
| Demographics | Rating | Rank | In Labor Force | Age > 16 |
| Spanish American Indians | 0.1 /100 | #292 | Tragic 63.8% |
| English | 0.1 /100 | #293 | Tragic 63.7% |
| Puget Sound Salish | 0.0 /100 | #294 | Tragic 63.7% |
| Immigrants | Canada | 0.0 /100 | #295 | Tragic 63.7% |
| Immigrants | North America | 0.0 /100 | #296 | Tragic 63.7% |
| Immigrants | Grenada | 0.0 /100 | #297 | Tragic 63.6% |
| Comanche | 0.0 /100 | #298 | Tragic 63.6% |
| Whites/Caucasians | 0.0 /100 | #299 | Tragic 63.6% |
| Immigrants | Azores | 0.0 /100 | #300 | Tragic 63.6% |
| Spanish Americans | 0.0 /100 | #301 | Tragic 63.6% |
| Delaware | 0.0 /100 | #302 | Tragic 63.6% |
| Cree | 0.0 /100 | #303 | Tragic 63.5% |
| Immigrants | Nonimmigrants | 0.0 /100 | #304 | Tragic 63.5% |
| Osage | 0.0 /100 | #305 | Tragic 63.5% |
| Blacks/African Americans | 0.0 /100 | #306 | Tragic 63.4% |