Potawatomi vs Malaysian Female Unemployment
COMPARE
Potawatomi
Malaysian
Female Unemployment
Female Unemployment Comparison
Potawatomi
Malaysians
5.2%
FEMALE UNEMPLOYMENT
65.9/ 100
METRIC RATING
162nd/ 347
METRIC RANK
5.3%
FEMALE UNEMPLOYMENT
40.1/ 100
METRIC RATING
185th/ 347
METRIC RANK
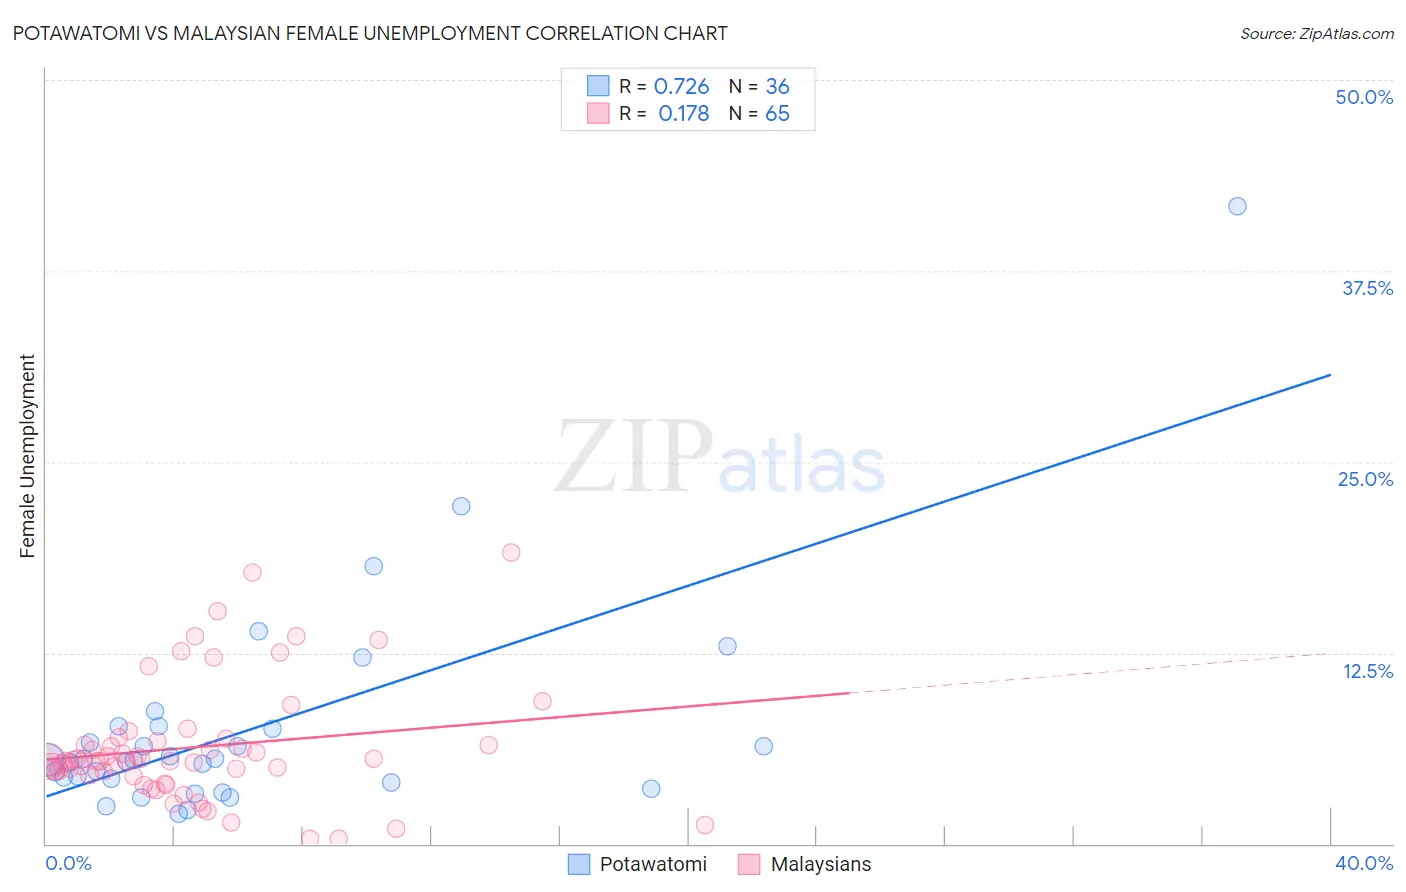
Potawatomi vs Malaysian Female Unemployment Correlation Chart
The statistical analysis conducted on geographies consisting of 117,345,234 people shows a strong positive correlation between the proportion of Potawatomi and unemploymnet rate among females in the United States with a correlation coefficient (R) of 0.726 and weighted average of 5.2%. Similarly, the statistical analysis conducted on geographies consisting of 225,706,419 people shows a poor positive correlation between the proportion of Malaysians and unemploymnet rate among females in the United States with a correlation coefficient (R) of 0.178 and weighted average of 5.3%, a difference of 1.6%.
Female Unemployment Correlation Summary
| Measurement | Potawatomi | Malaysian |
| Minimum | 2.0% | 0.30% |
| Maximum | 41.7% | 19.1% |
| Range | 39.7% | 18.8% |
| Mean | 7.5% | 6.3% |
| Median | 5.5% | 5.4% |
| Interquartile 25% (IQ1) | 4.1% | 4.5% |
| Interquartile 75% (IQ3) | 7.6% | 6.8% |
| Interquartile Range (IQR) | 3.5% | 2.3% |
| Standard Deviation (Sample) | 7.3% | 3.9% |
| Standard Deviation (Population) | 7.2% | 3.9% |
Similar Demographics by Female Unemployment
Demographics Similar to Potawatomi by Female Unemployment
In terms of female unemployment, the demographic groups most similar to Potawatomi are Immigrants from Pakistan (5.2%, a difference of 0.050%), Immigrants from Spain (5.2%, a difference of 0.060%), Immigrants from Micronesia (5.2%, a difference of 0.070%), Immigrants from Asia (5.2%, a difference of 0.11%), and Bangladeshi (5.2%, a difference of 0.11%).
| Demographics | Rating | Rank | Female Unemployment |
| Immigrants | Egypt | 70.0 /100 | #155 | Good 5.2% |
| Immigrants | Northern Africa | 69.6 /100 | #156 | Good 5.2% |
| Immigrants | Russia | 69.3 /100 | #157 | Good 5.2% |
| Albanians | 68.3 /100 | #158 | Good 5.2% |
| Immigrants | Micronesia | 66.9 /100 | #159 | Good 5.2% |
| Immigrants | Spain | 66.8 /100 | #160 | Good 5.2% |
| Immigrants | Pakistan | 66.7 /100 | #161 | Good 5.2% |
| Potawatomi | 65.9 /100 | #162 | Good 5.2% |
| Immigrants | Asia | 64.3 /100 | #163 | Good 5.2% |
| Bangladeshis | 64.3 /100 | #164 | Good 5.2% |
| Syrians | 62.8 /100 | #165 | Good 5.2% |
| Native Hawaiians | 62.7 /100 | #166 | Good 5.2% |
| Immigrants | Thailand | 62.1 /100 | #167 | Good 5.2% |
| Sri Lankans | 59.4 /100 | #168 | Average 5.2% |
| Immigrants | Chile | 59.0 /100 | #169 | Average 5.2% |
Demographics Similar to Malaysians by Female Unemployment
In terms of female unemployment, the demographic groups most similar to Malaysians are Immigrants from Ukraine (5.3%, a difference of 0.010%), Immigrants from Indonesia (5.3%, a difference of 0.040%), Immigrants from Belarus (5.3%, a difference of 0.040%), Taiwanese (5.3%, a difference of 0.16%), and Nonimmigrants (5.3%, a difference of 0.16%).
| Demographics | Rating | Rank | Female Unemployment |
| Immigrants | Southern Europe | 46.2 /100 | #178 | Average 5.3% |
| Laotians | 45.1 /100 | #179 | Average 5.3% |
| Immigrants | Congo | 43.1 /100 | #180 | Average 5.3% |
| Taiwanese | 42.7 /100 | #181 | Average 5.3% |
| Immigrants | Nonimmigrants | 42.6 /100 | #182 | Average 5.3% |
| Immigrants | Indonesia | 40.7 /100 | #183 | Average 5.3% |
| Immigrants | Ukraine | 40.1 /100 | #184 | Average 5.3% |
| Malaysians | 40.1 /100 | #185 | Average 5.3% |
| Immigrants | Belarus | 39.4 /100 | #186 | Fair 5.3% |
| Immigrants | Albania | 35.4 /100 | #187 | Fair 5.3% |
| Afghans | 33.9 /100 | #188 | Fair 5.3% |
| Costa Ricans | 33.8 /100 | #189 | Fair 5.3% |
| Ugandans | 31.2 /100 | #190 | Fair 5.3% |
| Cherokee | 30.8 /100 | #191 | Fair 5.3% |
| Portuguese | 28.6 /100 | #192 | Fair 5.3% |