Hungarian vs Immigrants from England In Labor Force | Age > 16
COMPARE
Hungarian
Immigrants from England
In Labor Force | Age > 16
In Labor Force | Age > 16 Comparison
Hungarians
Immigrants from England
63.8%
IN LABOR FORCE | AGE > 16
0.1/ 100
METRIC RATING
290th/ 347
METRIC RANK
64.2%
IN LABOR FORCE | AGE > 16
0.5/ 100
METRIC RATING
266th/ 347
METRIC RANK
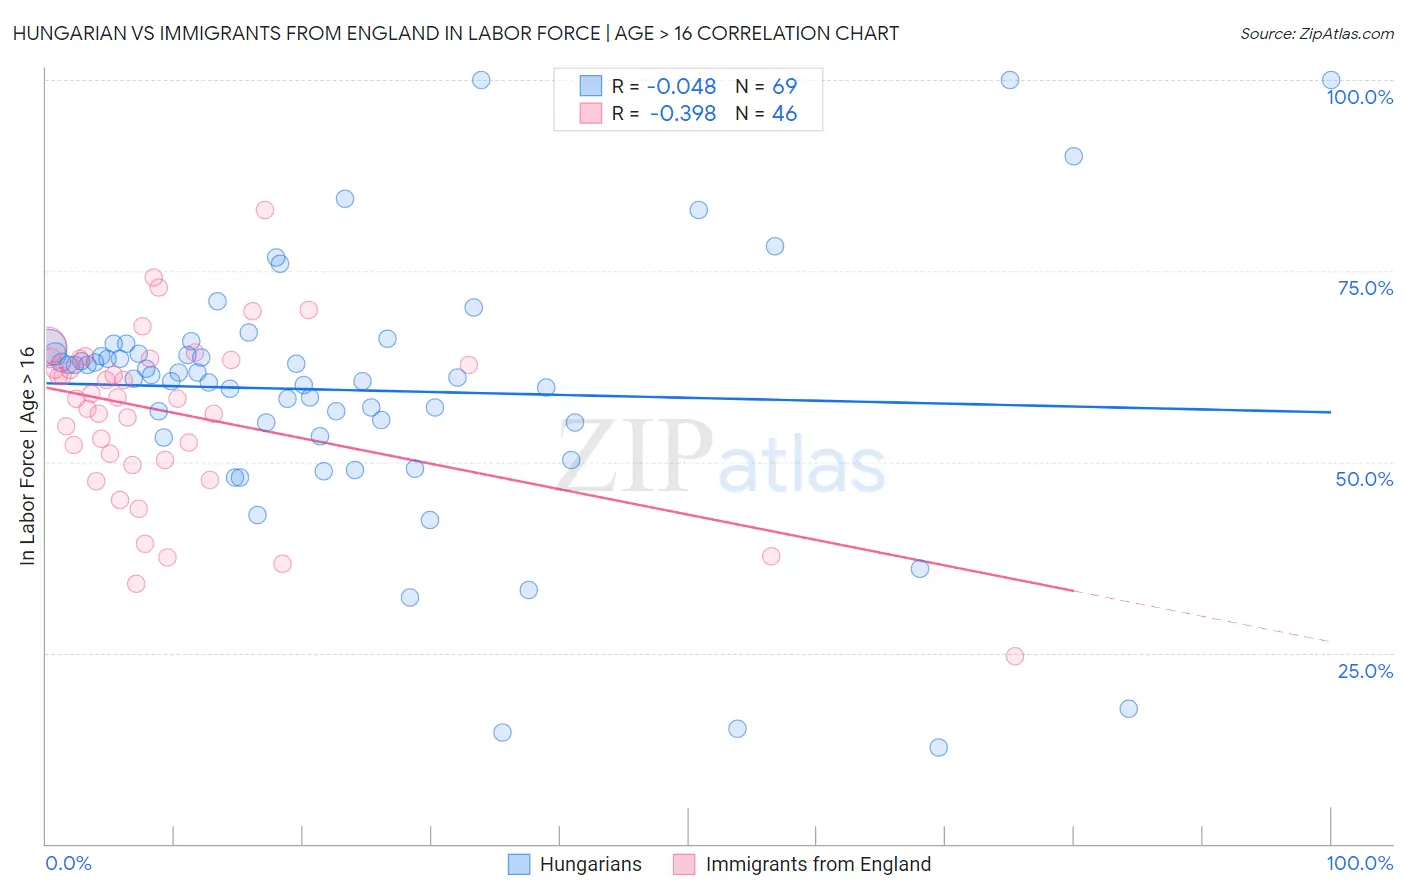
Hungarian vs Immigrants from England In Labor Force | Age > 16 Correlation Chart
The statistical analysis conducted on geographies consisting of 486,247,261 people shows no correlation between the proportion of Hungarians and labor force participation rate among population ages 16 and over in the United States with a correlation coefficient (R) of -0.048 and weighted average of 63.8%. Similarly, the statistical analysis conducted on geographies consisting of 391,897,781 people shows a mild negative correlation between the proportion of Immigrants from England and labor force participation rate among population ages 16 and over in the United States with a correlation coefficient (R) of -0.398 and weighted average of 64.2%, a difference of 0.53%.
In Labor Force | Age > 16 Correlation Summary
| Measurement | Hungarian | Immigrants from England |
| Minimum | 12.6% | 24.6% |
| Maximum | 100.0% | 83.0% |
| Range | 87.4% | 58.4% |
| Mean | 59.4% | 56.4% |
| Median | 61.3% | 58.3% |
| Interquartile 25% (IQ1) | 54.3% | 50.2% |
| Interquartile 75% (IQ3) | 64.6% | 63.5% |
| Interquartile Range (IQR) | 10.3% | 13.3% |
| Standard Deviation (Sample) | 17.2% | 11.5% |
| Standard Deviation (Population) | 17.0% | 11.3% |
Similar Demographics by In Labor Force | Age > 16
Demographics Similar to Hungarians by In Labor Force | Age > 16
In terms of in labor force | age > 16, the demographic groups most similar to Hungarians are Nepalese (63.8%, a difference of 0.010%), Celtic (63.8%, a difference of 0.030%), Spanish (63.9%, a difference of 0.060%), Spanish American Indian (63.8%, a difference of 0.070%), and Immigrants from Austria (63.9%, a difference of 0.10%).
| Demographics | Rating | Rank | In Labor Force | Age > 16 |
| Immigrants | Germany | 0.1 /100 | #283 | Tragic 63.9% |
| French | 0.1 /100 | #284 | Tragic 63.9% |
| Slovaks | 0.1 /100 | #285 | Tragic 63.9% |
| Immigrants | Austria | 0.1 /100 | #286 | Tragic 63.9% |
| Scottish | 0.1 /100 | #287 | Tragic 63.9% |
| Spanish | 0.1 /100 | #288 | Tragic 63.9% |
| Celtics | 0.1 /100 | #289 | Tragic 63.8% |
| Hungarians | 0.1 /100 | #290 | Tragic 63.8% |
| Nepalese | 0.1 /100 | #291 | Tragic 63.8% |
| Spanish American Indians | 0.1 /100 | #292 | Tragic 63.8% |
| English | 0.1 /100 | #293 | Tragic 63.7% |
| Puget Sound Salish | 0.0 /100 | #294 | Tragic 63.7% |
| Immigrants | Canada | 0.0 /100 | #295 | Tragic 63.7% |
| Immigrants | North America | 0.0 /100 | #296 | Tragic 63.7% |
| Immigrants | Grenada | 0.0 /100 | #297 | Tragic 63.6% |
Demographics Similar to Immigrants from England by In Labor Force | Age > 16
In terms of in labor force | age > 16, the demographic groups most similar to Immigrants from England are Cuban (64.2%, a difference of 0.010%), Canadian (64.1%, a difference of 0.010%), Spaniard (64.1%, a difference of 0.010%), Dutch (64.2%, a difference of 0.050%), and Irish (64.1%, a difference of 0.050%).
| Demographics | Rating | Rank | In Labor Force | Age > 16 |
| Immigrants | Western Europe | 0.7 /100 | #259 | Tragic 64.2% |
| Marshallese | 0.7 /100 | #260 | Tragic 64.2% |
| Basques | 0.7 /100 | #261 | Tragic 64.2% |
| Finns | 0.7 /100 | #262 | Tragic 64.2% |
| Bahamians | 0.6 /100 | #263 | Tragic 64.2% |
| Dutch | 0.6 /100 | #264 | Tragic 64.2% |
| Cubans | 0.5 /100 | #265 | Tragic 64.2% |
| Immigrants | England | 0.5 /100 | #266 | Tragic 64.2% |
| Canadians | 0.5 /100 | #267 | Tragic 64.1% |
| Spaniards | 0.5 /100 | #268 | Tragic 64.1% |
| Irish | 0.4 /100 | #269 | Tragic 64.1% |
| Guyanese | 0.4 /100 | #270 | Tragic 64.1% |
| Dominicans | 0.4 /100 | #271 | Tragic 64.1% |
| Native Hawaiians | 0.3 /100 | #272 | Tragic 64.1% |
| Hmong | 0.3 /100 | #273 | Tragic 64.1% |