Potawatomi vs Immigrants from England Professional Degree
COMPARE
Potawatomi
Immigrants from England
Professional Degree
Professional Degree Comparison
Potawatomi
Immigrants from England
3.6%
PROFESSIONAL DEGREE
0.5/ 100
METRIC RATING
274th/ 347
METRIC RANK
5.3%
PROFESSIONAL DEGREE
99.6/ 100
METRIC RATING
80th/ 347
METRIC RANK
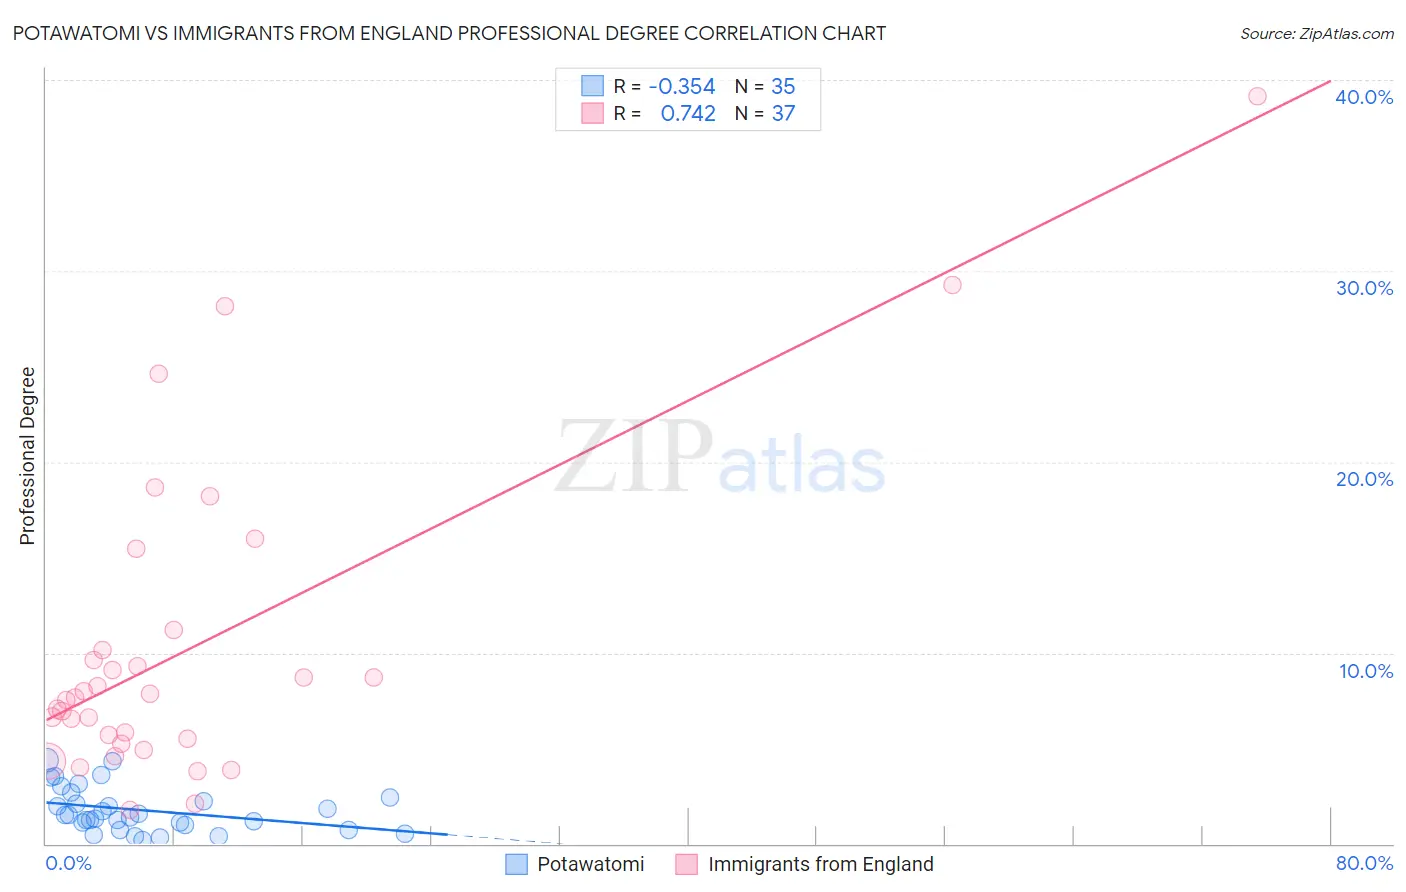
Potawatomi vs Immigrants from England Professional Degree Correlation Chart
The statistical analysis conducted on geographies consisting of 117,535,348 people shows a mild negative correlation between the proportion of Potawatomi and percentage of population with at least professional degree education in the United States with a correlation coefficient (R) of -0.354 and weighted average of 3.6%. Similarly, the statistical analysis conducted on geographies consisting of 391,206,555 people shows a strong positive correlation between the proportion of Immigrants from England and percentage of population with at least professional degree education in the United States with a correlation coefficient (R) of 0.742 and weighted average of 5.3%, a difference of 49.1%.
Professional Degree Correlation Summary
| Measurement | Potawatomi | Immigrants from England |
| Minimum | 0.21% | 1.8% |
| Maximum | 4.4% | 39.2% |
| Range | 4.2% | 37.4% |
| Mean | 1.8% | 10.3% |
| Median | 1.5% | 7.7% |
| Interquartile 25% (IQ1) | 1.0% | 5.4% |
| Interquartile 75% (IQ3) | 2.4% | 10.7% |
| Interquartile Range (IQR) | 1.4% | 5.3% |
| Standard Deviation (Sample) | 1.1% | 8.3% |
| Standard Deviation (Population) | 1.1% | 8.2% |
Similar Demographics by Professional Degree
Demographics Similar to Potawatomi by Professional Degree
In terms of professional degree, the demographic groups most similar to Potawatomi are American (3.6%, a difference of 0.13%), Immigrants from Jamaica (3.6%, a difference of 0.19%), Belizean (3.6%, a difference of 0.22%), Immigrants from Dominica (3.6%, a difference of 0.23%), and Liberian (3.6%, a difference of 0.27%).
| Demographics | Rating | Rank | Professional Degree |
| Delaware | 0.7 /100 | #267 | Tragic 3.6% |
| Aleuts | 0.7 /100 | #268 | Tragic 3.6% |
| Immigrants | Cuba | 0.6 /100 | #269 | Tragic 3.6% |
| Central Americans | 0.6 /100 | #270 | Tragic 3.6% |
| Belizeans | 0.5 /100 | #271 | Tragic 3.6% |
| Immigrants | Jamaica | 0.5 /100 | #272 | Tragic 3.6% |
| Americans | 0.5 /100 | #273 | Tragic 3.6% |
| Potawatomi | 0.5 /100 | #274 | Tragic 3.6% |
| Immigrants | Dominica | 0.5 /100 | #275 | Tragic 3.6% |
| Liberians | 0.5 /100 | #276 | Tragic 3.6% |
| Cheyenne | 0.5 /100 | #277 | Tragic 3.6% |
| Japanese | 0.5 /100 | #278 | Tragic 3.5% |
| Immigrants | Portugal | 0.5 /100 | #279 | Tragic 3.5% |
| Dominicans | 0.5 /100 | #280 | Tragic 3.5% |
| Apache | 0.5 /100 | #281 | Tragic 3.5% |
Demographics Similar to Immigrants from England by Professional Degree
In terms of professional degree, the demographic groups most similar to Immigrants from England are Immigrants from Brazil (5.3%, a difference of 0.010%), Immigrants from North America (5.3%, a difference of 0.39%), Romanian (5.3%, a difference of 0.51%), Armenian (5.3%, a difference of 0.56%), and Immigrants from Ethiopia (5.3%, a difference of 0.60%).
| Demographics | Rating | Rank | Professional Degree |
| Immigrants | Romania | 99.8 /100 | #73 | Exceptional 5.4% |
| Ethiopians | 99.7 /100 | #74 | Exceptional 5.4% |
| Immigrants | Indonesia | 99.7 /100 | #75 | Exceptional 5.3% |
| Immigrants | Canada | 99.7 /100 | #76 | Exceptional 5.3% |
| Immigrants | Ethiopia | 99.7 /100 | #77 | Exceptional 5.3% |
| Armenians | 99.7 /100 | #78 | Exceptional 5.3% |
| Immigrants | North America | 99.7 /100 | #79 | Exceptional 5.3% |
| Immigrants | England | 99.6 /100 | #80 | Exceptional 5.3% |
| Immigrants | Brazil | 99.6 /100 | #81 | Exceptional 5.3% |
| Romanians | 99.6 /100 | #82 | Exceptional 5.3% |
| Carpatho Rusyns | 99.6 /100 | #83 | Exceptional 5.3% |
| Immigrants | Croatia | 99.6 /100 | #84 | Exceptional 5.3% |
| Immigrants | Zimbabwe | 99.6 /100 | #85 | Exceptional 5.3% |
| Greeks | 99.6 /100 | #86 | Exceptional 5.3% |
| Immigrants | Chile | 99.5 /100 | #87 | Exceptional 5.3% |