Potawatomi vs Immigrants from Ecuador Female Unemployment
COMPARE
Potawatomi
Immigrants from Ecuador
Female Unemployment
Female Unemployment Comparison
Potawatomi
Immigrants from Ecuador
5.2%
FEMALE UNEMPLOYMENT
65.9/ 100
METRIC RATING
162nd/ 347
METRIC RANK
6.4%
FEMALE UNEMPLOYMENT
0.0/ 100
METRIC RATING
314th/ 347
METRIC RANK
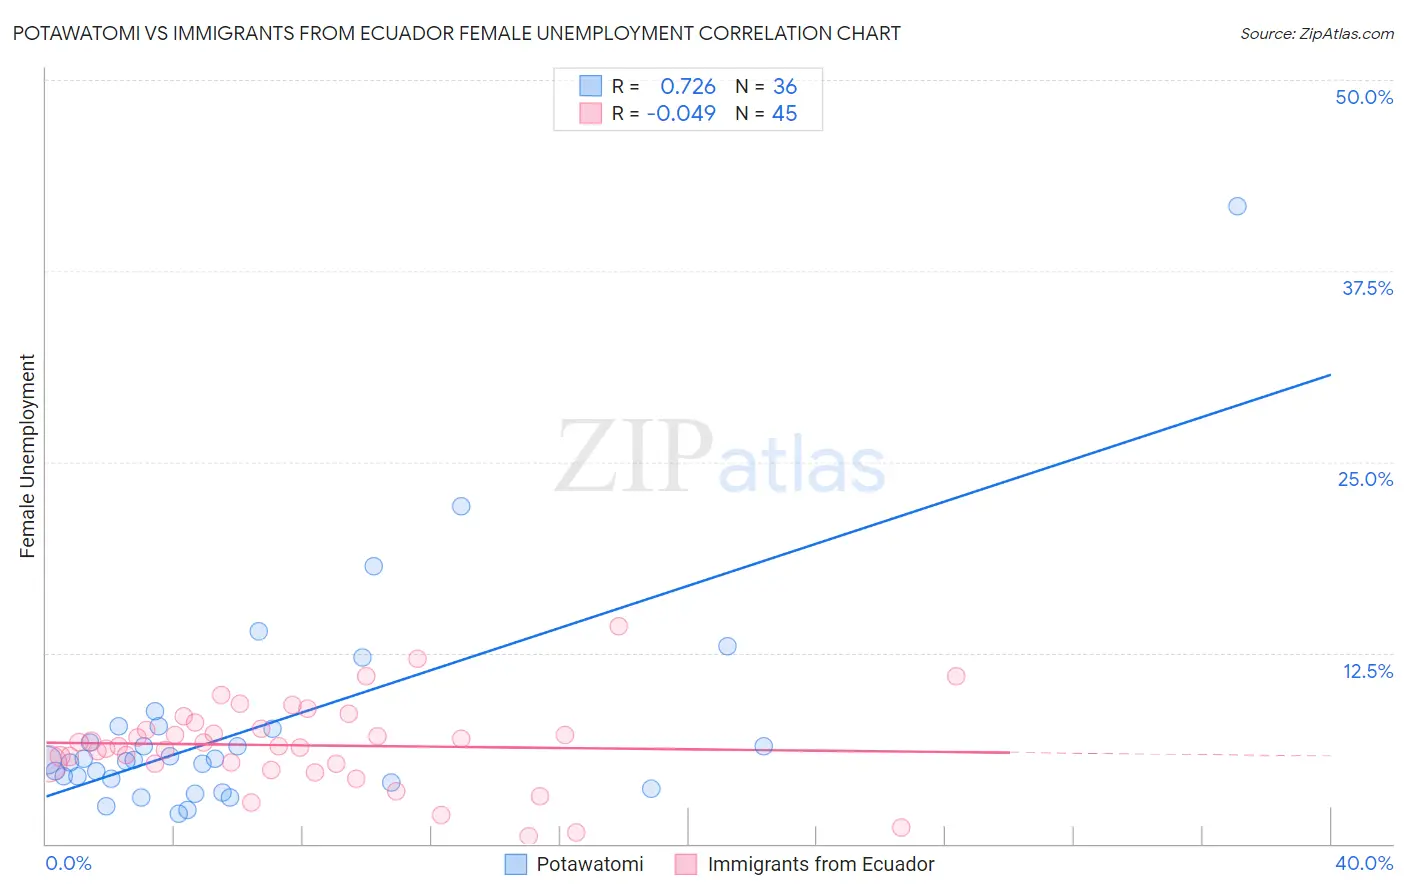
Potawatomi vs Immigrants from Ecuador Female Unemployment Correlation Chart
The statistical analysis conducted on geographies consisting of 117,345,234 people shows a strong positive correlation between the proportion of Potawatomi and unemploymnet rate among females in the United States with a correlation coefficient (R) of 0.726 and weighted average of 5.2%. Similarly, the statistical analysis conducted on geographies consisting of 270,415,803 people shows no correlation between the proportion of Immigrants from Ecuador and unemploymnet rate among females in the United States with a correlation coefficient (R) of -0.049 and weighted average of 6.4%, a difference of 22.2%.
Female Unemployment Correlation Summary
| Measurement | Potawatomi | Immigrants from Ecuador |
| Minimum | 2.0% | 0.51% |
| Maximum | 41.7% | 14.2% |
| Range | 39.7% | 13.7% |
| Mean | 7.5% | 6.4% |
| Median | 5.5% | 6.4% |
| Interquartile 25% (IQ1) | 4.1% | 5.2% |
| Interquartile 75% (IQ3) | 7.6% | 7.7% |
| Interquartile Range (IQR) | 3.5% | 2.5% |
| Standard Deviation (Sample) | 7.3% | 2.8% |
| Standard Deviation (Population) | 7.2% | 2.8% |
Similar Demographics by Female Unemployment
Demographics Similar to Potawatomi by Female Unemployment
In terms of female unemployment, the demographic groups most similar to Potawatomi are Immigrants from Pakistan (5.2%, a difference of 0.050%), Immigrants from Spain (5.2%, a difference of 0.060%), Immigrants from Micronesia (5.2%, a difference of 0.070%), Immigrants from Asia (5.2%, a difference of 0.11%), and Bangladeshi (5.2%, a difference of 0.11%).
| Demographics | Rating | Rank | Female Unemployment |
| Immigrants | Egypt | 70.0 /100 | #155 | Good 5.2% |
| Immigrants | Northern Africa | 69.6 /100 | #156 | Good 5.2% |
| Immigrants | Russia | 69.3 /100 | #157 | Good 5.2% |
| Albanians | 68.3 /100 | #158 | Good 5.2% |
| Immigrants | Micronesia | 66.9 /100 | #159 | Good 5.2% |
| Immigrants | Spain | 66.8 /100 | #160 | Good 5.2% |
| Immigrants | Pakistan | 66.7 /100 | #161 | Good 5.2% |
| Potawatomi | 65.9 /100 | #162 | Good 5.2% |
| Immigrants | Asia | 64.3 /100 | #163 | Good 5.2% |
| Bangladeshis | 64.3 /100 | #164 | Good 5.2% |
| Syrians | 62.8 /100 | #165 | Good 5.2% |
| Native Hawaiians | 62.7 /100 | #166 | Good 5.2% |
| Immigrants | Thailand | 62.1 /100 | #167 | Good 5.2% |
| Sri Lankans | 59.4 /100 | #168 | Average 5.2% |
| Immigrants | Chile | 59.0 /100 | #169 | Average 5.2% |
Demographics Similar to Immigrants from Ecuador by Female Unemployment
In terms of female unemployment, the demographic groups most similar to Immigrants from Ecuador are Belizean (6.3%, a difference of 0.23%), Immigrants from Grenada (6.3%, a difference of 0.24%), Pueblo (6.4%, a difference of 0.31%), Houma (6.4%, a difference of 0.60%), and Immigrants from Mexico (6.3%, a difference of 0.90%).
| Demographics | Rating | Rank | Female Unemployment |
| Shoshone | 0.0 /100 | #307 | Tragic 6.2% |
| Hispanics or Latinos | 0.0 /100 | #308 | Tragic 6.2% |
| Ecuadorians | 0.0 /100 | #309 | Tragic 6.3% |
| Central American Indians | 0.0 /100 | #310 | Tragic 6.3% |
| Immigrants | Mexico | 0.0 /100 | #311 | Tragic 6.3% |
| Immigrants | Grenada | 0.0 /100 | #312 | Tragic 6.3% |
| Belizeans | 0.0 /100 | #313 | Tragic 6.3% |
| Immigrants | Ecuador | 0.0 /100 | #314 | Tragic 6.4% |
| Pueblo | 0.0 /100 | #315 | Tragic 6.4% |
| Houma | 0.0 /100 | #316 | Tragic 6.4% |
| Immigrants | St. Vincent and the Grenadines | 0.0 /100 | #317 | Tragic 6.4% |
| British West Indians | 0.0 /100 | #318 | Tragic 6.4% |
| Immigrants | Bangladesh | 0.0 /100 | #319 | Tragic 6.5% |
| Immigrants | Dominica | 0.0 /100 | #320 | Tragic 6.5% |
| Blacks/African Americans | 0.0 /100 | #321 | Tragic 6.5% |