Immigrants from North Macedonia vs Immigrants from Sudan In Labor Force | Age 20-64
COMPARE
Immigrants from North Macedonia
Immigrants from Sudan
In Labor Force | Age 20-64
In Labor Force | Age 20-64 Comparison
Immigrants from North Macedonia
Immigrants from Sudan
80.7%
IN LABOR FORCE | AGE 20-64
99.9/ 100
METRIC RATING
30th/ 347
METRIC RANK
80.4%
IN LABOR FORCE | AGE 20-64
99.4/ 100
METRIC RATING
50th/ 347
METRIC RANK
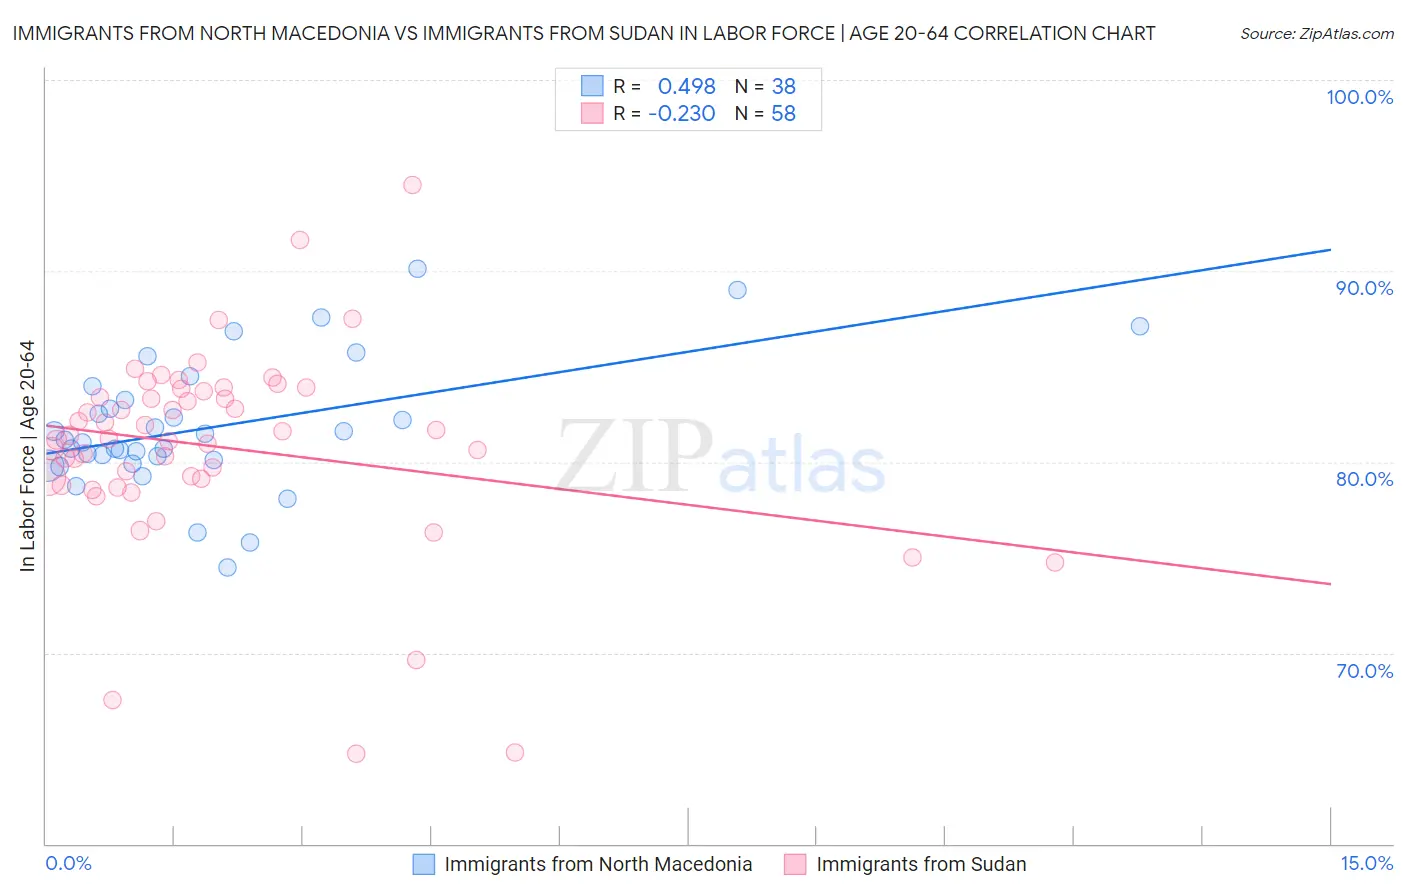
Immigrants from North Macedonia vs Immigrants from Sudan In Labor Force | Age 20-64 Correlation Chart
The statistical analysis conducted on geographies consisting of 74,317,186 people shows a moderate positive correlation between the proportion of Immigrants from North Macedonia and labor force participation rate among population between the ages 20 and 64 in the United States with a correlation coefficient (R) of 0.498 and weighted average of 80.7%. Similarly, the statistical analysis conducted on geographies consisting of 118,972,362 people shows a weak negative correlation between the proportion of Immigrants from Sudan and labor force participation rate among population between the ages 20 and 64 in the United States with a correlation coefficient (R) of -0.230 and weighted average of 80.4%, a difference of 0.43%.
In Labor Force | Age 20-64 Correlation Summary
| Measurement | Immigrants from North Macedonia | Immigrants from Sudan |
| Minimum | 74.4% | 64.7% |
| Maximum | 90.1% | 94.5% |
| Range | 15.7% | 29.8% |
| Mean | 81.8% | 80.8% |
| Median | 81.1% | 81.3% |
| Interquartile 25% (IQ1) | 80.1% | 79.1% |
| Interquartile 75% (IQ3) | 83.2% | 83.7% |
| Interquartile Range (IQR) | 3.1% | 4.6% |
| Standard Deviation (Sample) | 3.4% | 5.2% |
| Standard Deviation (Population) | 3.4% | 5.2% |
Demographics Similar to Immigrants from North Macedonia and Immigrants from Sudan by In Labor Force | Age 20-64
In terms of in labor force | age 20-64, the demographic groups most similar to Immigrants from North Macedonia are Immigrants from Lithuania (80.7%, a difference of 0.020%), Immigrants from Ireland (80.7%, a difference of 0.030%), Chinese (80.7%, a difference of 0.060%), Immigrants from Brazil (80.7%, a difference of 0.090%), and Immigrants from Poland (80.6%, a difference of 0.11%). Similarly, the demographic groups most similar to Immigrants from Sudan are Immigrants from Greece (80.4%, a difference of 0.020%), Immigrants from Hong Kong (80.4%, a difference of 0.050%), Immigrants from Africa (80.4%, a difference of 0.070%), Immigrants from Pakistan (80.5%, a difference of 0.11%), and Slovene (80.5%, a difference of 0.12%).
| Demographics | Rating | Rank | In Labor Force | Age 20-64 |
| Immigrants | North Macedonia | 99.9 /100 | #30 | Exceptional 80.7% |
| Immigrants | Lithuania | 99.9 /100 | #31 | Exceptional 80.7% |
| Immigrants | Ireland | 99.9 /100 | #32 | Exceptional 80.7% |
| Chinese | 99.9 /100 | #33 | Exceptional 80.7% |
| Immigrants | Brazil | 99.9 /100 | #34 | Exceptional 80.7% |
| Immigrants | Poland | 99.9 /100 | #35 | Exceptional 80.6% |
| Paraguayans | 99.8 /100 | #36 | Exceptional 80.6% |
| Immigrants | Moldova | 99.8 /100 | #37 | Exceptional 80.6% |
| Ugandans | 99.8 /100 | #38 | Exceptional 80.6% |
| Brazilians | 99.8 /100 | #39 | Exceptional 80.5% |
| Immigrants | Zimbabwe | 99.8 /100 | #40 | Exceptional 80.5% |
| Immigrants | Liberia | 99.8 /100 | #41 | Exceptional 80.5% |
| Latvians | 99.8 /100 | #42 | Exceptional 80.5% |
| Czechs | 99.7 /100 | #43 | Exceptional 80.5% |
| Immigrants | Middle Africa | 99.7 /100 | #44 | Exceptional 80.5% |
| Slovenes | 99.7 /100 | #45 | Exceptional 80.5% |
| Immigrants | Pakistan | 99.6 /100 | #46 | Exceptional 80.5% |
| Immigrants | Africa | 99.6 /100 | #47 | Exceptional 80.4% |
| Immigrants | Hong Kong | 99.5 /100 | #48 | Exceptional 80.4% |
| Immigrants | Greece | 99.4 /100 | #49 | Exceptional 80.4% |
| Immigrants | Sudan | 99.4 /100 | #50 | Exceptional 80.4% |