Immigrants from Belize vs Immigrants from Sudan In Labor Force | Age 20-64
COMPARE
Immigrants from Belize
Immigrants from Sudan
In Labor Force | Age 20-64
In Labor Force | Age 20-64 Comparison
Immigrants from Belize
Immigrants from Sudan
78.0%
IN LABOR FORCE | AGE 20-64
0.0/ 100
METRIC RATING
286th/ 347
METRIC RANK
80.4%
IN LABOR FORCE | AGE 20-64
99.4/ 100
METRIC RATING
50th/ 347
METRIC RANK
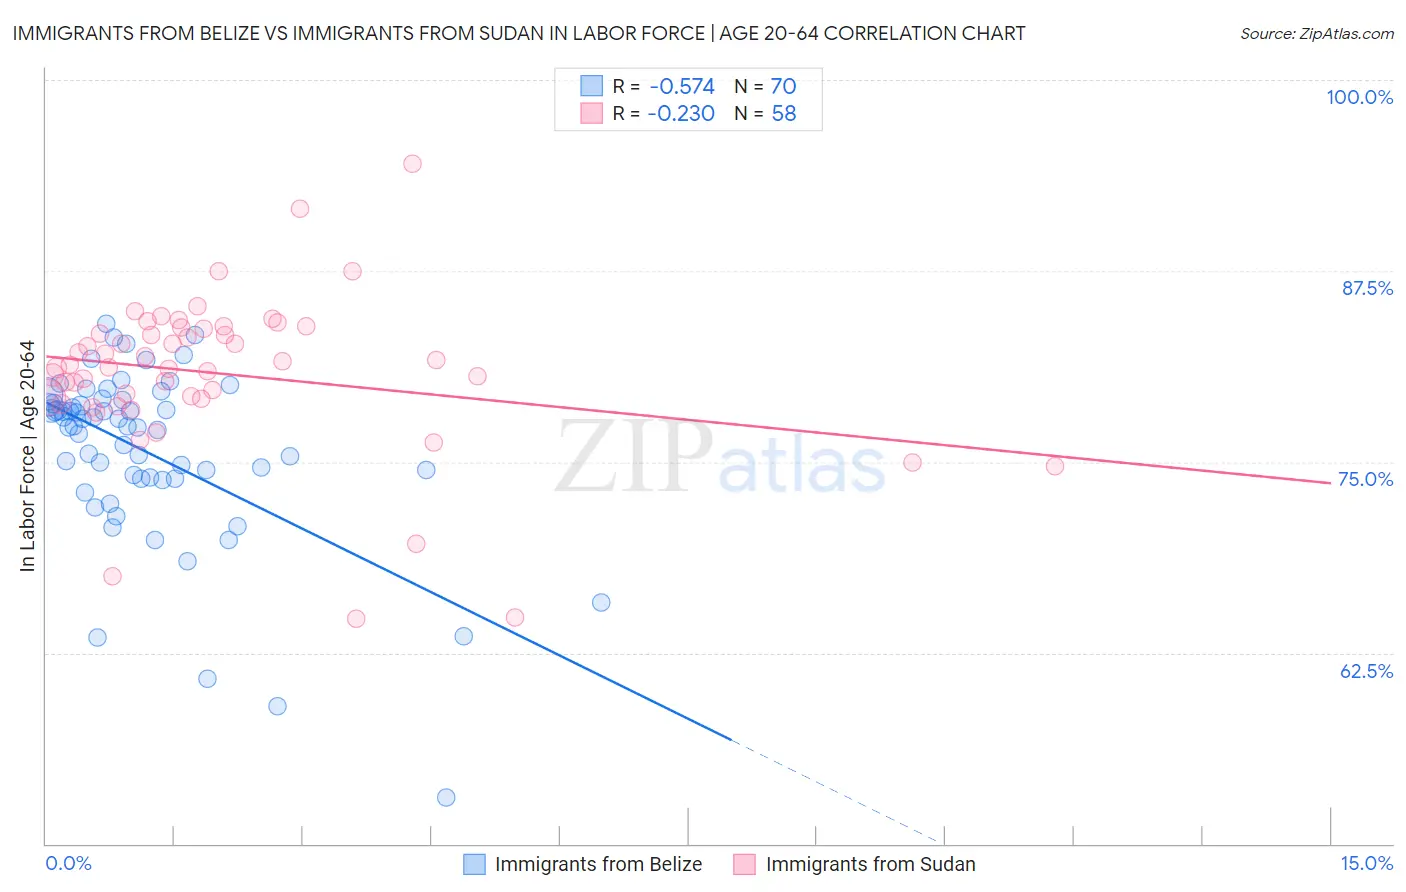
Immigrants from Belize vs Immigrants from Sudan In Labor Force | Age 20-64 Correlation Chart
The statistical analysis conducted on geographies consisting of 130,318,427 people shows a substantial negative correlation between the proportion of Immigrants from Belize and labor force participation rate among population between the ages 20 and 64 in the United States with a correlation coefficient (R) of -0.574 and weighted average of 78.0%. Similarly, the statistical analysis conducted on geographies consisting of 118,972,362 people shows a weak negative correlation between the proportion of Immigrants from Sudan and labor force participation rate among population between the ages 20 and 64 in the United States with a correlation coefficient (R) of -0.230 and weighted average of 80.4%, a difference of 3.1%.
In Labor Force | Age 20-64 Correlation Summary
| Measurement | Immigrants from Belize | Immigrants from Sudan |
| Minimum | 53.0% | 64.7% |
| Maximum | 84.0% | 94.5% |
| Range | 31.0% | 29.8% |
| Mean | 75.6% | 80.8% |
| Median | 77.3% | 81.3% |
| Interquartile 25% (IQ1) | 73.9% | 79.1% |
| Interquartile 75% (IQ3) | 78.8% | 83.7% |
| Interquartile Range (IQR) | 4.9% | 4.6% |
| Standard Deviation (Sample) | 5.8% | 5.2% |
| Standard Deviation (Population) | 5.7% | 5.2% |
Similar Demographics by In Labor Force | Age 20-64
Demographics Similar to Immigrants from Belize by In Labor Force | Age 20-64
In terms of in labor force | age 20-64, the demographic groups most similar to Immigrants from Belize are Vietnamese (78.0%, a difference of 0.0%), Osage (78.0%, a difference of 0.010%), Hmong (77.9%, a difference of 0.080%), African (77.9%, a difference of 0.090%), and Immigrants from Bangladesh (77.9%, a difference of 0.10%).
| Demographics | Rating | Rank | In Labor Force | Age 20-64 |
| Belizeans | 0.0 /100 | #279 | Tragic 78.2% |
| Immigrants | Dominica | 0.0 /100 | #280 | Tragic 78.1% |
| Guyanese | 0.0 /100 | #281 | Tragic 78.1% |
| Immigrants | St. Vincent and the Grenadines | 0.0 /100 | #282 | Tragic 78.1% |
| Immigrants | Nonimmigrants | 0.0 /100 | #283 | Tragic 78.1% |
| Immigrants | Guyana | 0.0 /100 | #284 | Tragic 78.1% |
| Osage | 0.0 /100 | #285 | Tragic 78.0% |
| Immigrants | Belize | 0.0 /100 | #286 | Tragic 78.0% |
| Vietnamese | 0.0 /100 | #287 | Tragic 78.0% |
| Hmong | 0.0 /100 | #288 | Tragic 77.9% |
| Africans | 0.0 /100 | #289 | Tragic 77.9% |
| Immigrants | Bangladesh | 0.0 /100 | #290 | Tragic 77.9% |
| Spanish Americans | 0.0 /100 | #291 | Tragic 77.8% |
| Immigrants | Azores | 0.0 /100 | #292 | Tragic 77.8% |
| Delaware | 0.0 /100 | #293 | Tragic 77.8% |
Demographics Similar to Immigrants from Sudan by In Labor Force | Age 20-64
In terms of in labor force | age 20-64, the demographic groups most similar to Immigrants from Sudan are Immigrants from Greece (80.4%, a difference of 0.020%), Immigrants from Sri Lanka (80.4%, a difference of 0.030%), Turkish (80.3%, a difference of 0.040%), Immigrants from Hong Kong (80.4%, a difference of 0.050%), and Immigrants from Peru (80.3%, a difference of 0.060%).
| Demographics | Rating | Rank | In Labor Force | Age 20-64 |
| Czechs | 99.7 /100 | #43 | Exceptional 80.5% |
| Immigrants | Middle Africa | 99.7 /100 | #44 | Exceptional 80.5% |
| Slovenes | 99.7 /100 | #45 | Exceptional 80.5% |
| Immigrants | Pakistan | 99.6 /100 | #46 | Exceptional 80.5% |
| Immigrants | Africa | 99.6 /100 | #47 | Exceptional 80.4% |
| Immigrants | Hong Kong | 99.5 /100 | #48 | Exceptional 80.4% |
| Immigrants | Greece | 99.4 /100 | #49 | Exceptional 80.4% |
| Immigrants | Sudan | 99.4 /100 | #50 | Exceptional 80.4% |
| Immigrants | Sri Lanka | 99.3 /100 | #51 | Exceptional 80.4% |
| Turks | 99.2 /100 | #52 | Exceptional 80.3% |
| Immigrants | Peru | 99.2 /100 | #53 | Exceptional 80.3% |
| Peruvians | 99.1 /100 | #54 | Exceptional 80.3% |
| Immigrants | Cabo Verde | 99.0 /100 | #55 | Exceptional 80.3% |
| Immigrants | Northern Africa | 99.0 /100 | #56 | Exceptional 80.3% |
| Afghans | 98.9 /100 | #57 | Exceptional 80.3% |