Venezuelan vs Lumbee In Labor Force | Age 35-44
COMPARE
Venezuelan
Lumbee
In Labor Force | Age 35-44
In Labor Force | Age 35-44 Comparison
Venezuelans
Lumbee
84.4%
IN LABOR FORCE | AGE 35-44
58.1/ 100
METRIC RATING
165th/ 347
METRIC RANK
77.0%
IN LABOR FORCE | AGE 35-44
0.0/ 100
METRIC RATING
340th/ 347
METRIC RANK
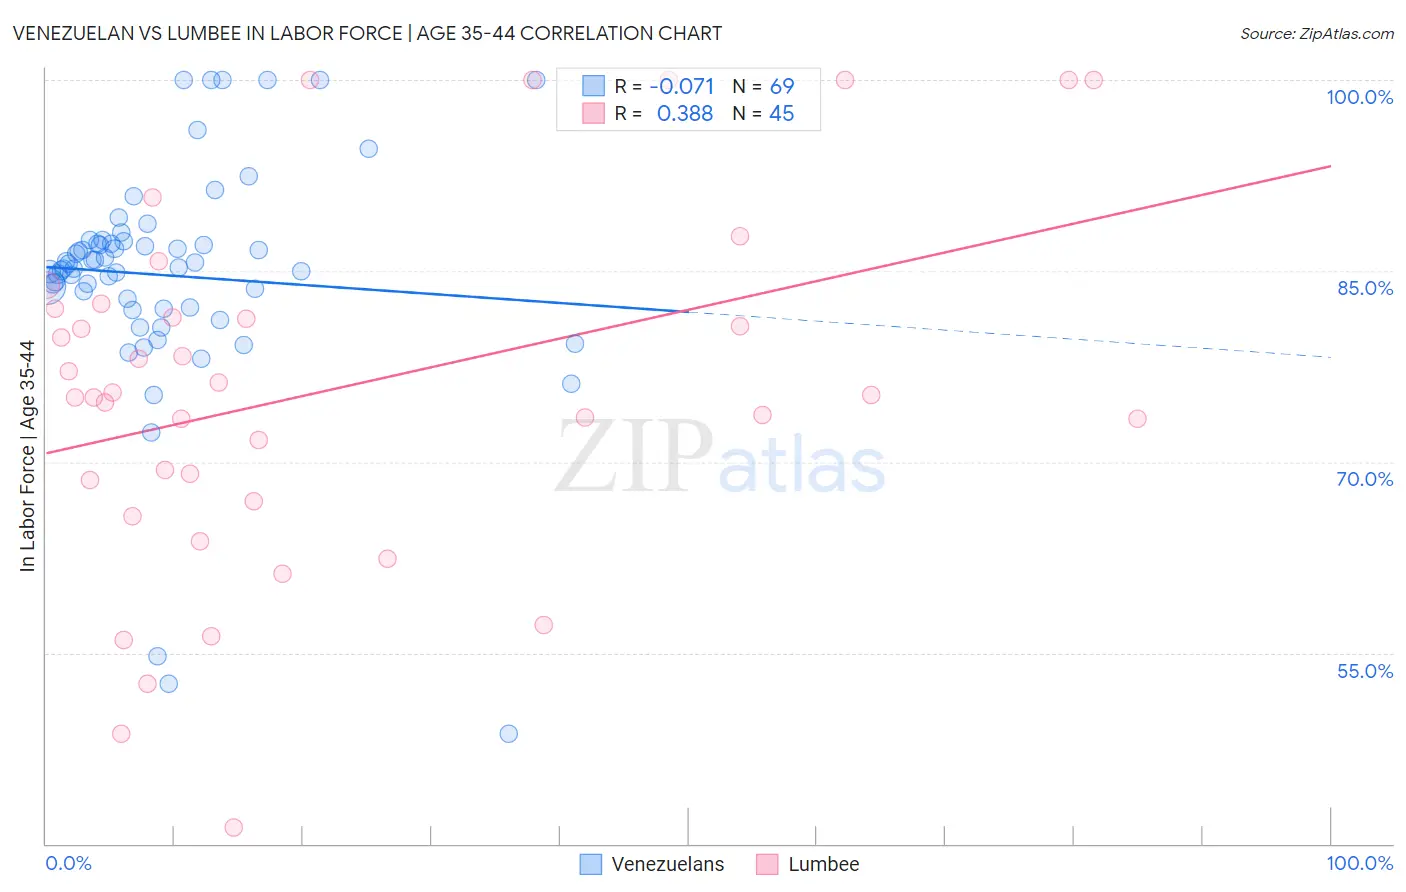
Venezuelan vs Lumbee In Labor Force | Age 35-44 Correlation Chart
The statistical analysis conducted on geographies consisting of 306,190,381 people shows a slight negative correlation between the proportion of Venezuelans and labor force participation rate among population between the ages 35 and 44 in the United States with a correlation coefficient (R) of -0.071 and weighted average of 84.4%. Similarly, the statistical analysis conducted on geographies consisting of 92,275,776 people shows a mild positive correlation between the proportion of Lumbee and labor force participation rate among population between the ages 35 and 44 in the United States with a correlation coefficient (R) of 0.388 and weighted average of 77.0%, a difference of 9.6%.
In Labor Force | Age 35-44 Correlation Summary
| Measurement | Venezuelan | Lumbee |
| Minimum | 48.6% | 41.3% |
| Maximum | 100.0% | 100.0% |
| Range | 51.4% | 58.7% |
| Mean | 84.6% | 75.7% |
| Median | 85.3% | 75.3% |
| Interquartile 25% (IQ1) | 82.1% | 67.7% |
| Interquartile 75% (IQ3) | 87.2% | 82.2% |
| Interquartile Range (IQR) | 5.2% | 14.5% |
| Standard Deviation (Sample) | 9.2% | 14.1% |
| Standard Deviation (Population) | 9.1% | 13.9% |
Similar Demographics by In Labor Force | Age 35-44
Demographics Similar to Venezuelans by In Labor Force | Age 35-44
In terms of in labor force | age 35-44, the demographic groups most similar to Venezuelans are Immigrants from Venezuela (84.4%, a difference of 0.010%), Immigrants from Hungary (84.4%, a difference of 0.010%), Aleut (84.4%, a difference of 0.010%), Nigerian (84.4%, a difference of 0.010%), and Immigrants from Senegal (84.4%, a difference of 0.020%).
| Demographics | Rating | Rank | In Labor Force | Age 35-44 |
| Jamaicans | 62.7 /100 | #158 | Good 84.4% |
| Immigrants | Senegal | 60.4 /100 | #159 | Good 84.4% |
| Immigrants | Kazakhstan | 60.4 /100 | #160 | Good 84.4% |
| Immigrants | Venezuela | 60.0 /100 | #161 | Good 84.4% |
| Immigrants | Hungary | 59.4 /100 | #162 | Average 84.4% |
| Aleuts | 59.1 /100 | #163 | Average 84.4% |
| Nigerians | 58.9 /100 | #164 | Average 84.4% |
| Venezuelans | 58.1 /100 | #165 | Average 84.4% |
| Alsatians | 55.2 /100 | #166 | Average 84.4% |
| Immigrants | Portugal | 55.2 /100 | #167 | Average 84.4% |
| Irish | 53.1 /100 | #168 | Average 84.4% |
| Immigrants | Afghanistan | 52.7 /100 | #169 | Average 84.4% |
| Immigrants | Jordan | 52.5 /100 | #170 | Average 84.4% |
| Jordanians | 51.7 /100 | #171 | Average 84.4% |
| Scandinavians | 51.2 /100 | #172 | Average 84.4% |
Demographics Similar to Lumbee by In Labor Force | Age 35-44
In terms of in labor force | age 35-44, the demographic groups most similar to Lumbee are Hopi (77.0%, a difference of 0.050%), Yup'ik (77.3%, a difference of 0.35%), Pueblo (77.4%, a difference of 0.46%), Crow (76.5%, a difference of 0.69%), and Immigrants from Yemen (76.3%, a difference of 0.93%).
| Demographics | Rating | Rank | In Labor Force | Age 35-44 |
| Kiowa | 0.0 /100 | #333 | Tragic 79.2% |
| Yakama | 0.0 /100 | #334 | Tragic 79.0% |
| Natives/Alaskans | 0.0 /100 | #335 | Tragic 78.9% |
| Arapaho | 0.0 /100 | #336 | Tragic 78.1% |
| Apache | 0.0 /100 | #337 | Tragic 77.9% |
| Pueblo | 0.0 /100 | #338 | Tragic 77.4% |
| Yup'ik | 0.0 /100 | #339 | Tragic 77.3% |
| Lumbee | 0.0 /100 | #340 | Tragic 77.0% |
| Hopi | 0.0 /100 | #341 | Tragic 77.0% |
| Crow | 0.0 /100 | #342 | Tragic 76.5% |
| Immigrants | Yemen | 0.0 /100 | #343 | Tragic 76.3% |
| Pima | 0.0 /100 | #344 | Tragic 74.8% |
| Yuman | 0.0 /100 | #345 | Tragic 74.7% |
| Tohono O'odham | 0.0 /100 | #346 | Tragic 74.1% |
| Navajo | 0.0 /100 | #347 | Tragic 73.8% |