French Canadian vs Lumbee In Labor Force | Age 35-44
COMPARE
French Canadian
Lumbee
In Labor Force | Age 35-44
In Labor Force | Age 35-44 Comparison
French Canadians
Lumbee
84.3%
IN LABOR FORCE | AGE 35-44
44.3/ 100
METRIC RATING
177th/ 347
METRIC RANK
77.0%
IN LABOR FORCE | AGE 35-44
0.0/ 100
METRIC RATING
340th/ 347
METRIC RANK
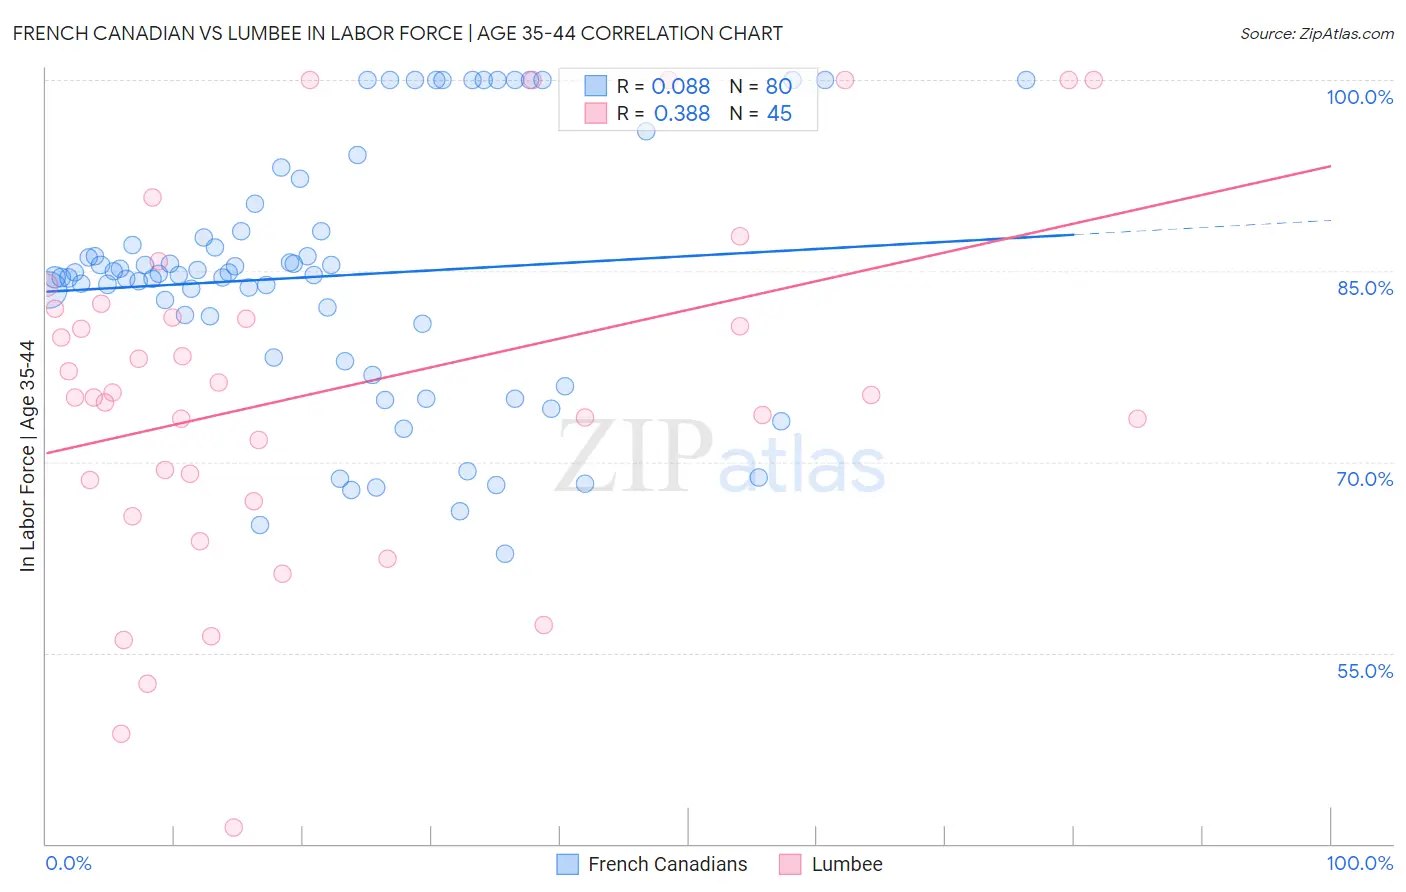
French Canadian vs Lumbee In Labor Force | Age 35-44 Correlation Chart
The statistical analysis conducted on geographies consisting of 502,298,935 people shows a slight positive correlation between the proportion of French Canadians and labor force participation rate among population between the ages 35 and 44 in the United States with a correlation coefficient (R) of 0.088 and weighted average of 84.3%. Similarly, the statistical analysis conducted on geographies consisting of 92,275,776 people shows a mild positive correlation between the proportion of Lumbee and labor force participation rate among population between the ages 35 and 44 in the United States with a correlation coefficient (R) of 0.388 and weighted average of 77.0%, a difference of 9.5%.
In Labor Force | Age 35-44 Correlation Summary
| Measurement | French Canadian | Lumbee |
| Minimum | 62.7% | 41.3% |
| Maximum | 100.0% | 100.0% |
| Range | 37.3% | 58.7% |
| Mean | 84.6% | 75.7% |
| Median | 84.7% | 75.3% |
| Interquartile 25% (IQ1) | 79.5% | 67.7% |
| Interquartile 75% (IQ3) | 88.1% | 82.2% |
| Interquartile Range (IQR) | 8.6% | 14.5% |
| Standard Deviation (Sample) | 9.9% | 14.1% |
| Standard Deviation (Population) | 9.8% | 13.9% |
Similar Demographics by In Labor Force | Age 35-44
Demographics Similar to French Canadians by In Labor Force | Age 35-44
In terms of in labor force | age 35-44, the demographic groups most similar to French Canadians are Northern European (84.3%, a difference of 0.0%), Immigrants from South Africa (84.3%, a difference of 0.010%), Sri Lankan (84.4%, a difference of 0.020%), Pakistani (84.4%, a difference of 0.030%), and Scandinavian (84.4%, a difference of 0.040%).
| Demographics | Rating | Rank | In Labor Force | Age 35-44 |
| Immigrants | Jordan | 52.5 /100 | #170 | Average 84.4% |
| Jordanians | 51.7 /100 | #171 | Average 84.4% |
| Scandinavians | 51.2 /100 | #172 | Average 84.4% |
| Immigrants | Trinidad and Tobago | 50.7 /100 | #173 | Average 84.4% |
| Immigrants | Iran | 50.0 /100 | #174 | Average 84.4% |
| Pakistanis | 48.2 /100 | #175 | Average 84.4% |
| Sri Lankans | 47.3 /100 | #176 | Average 84.4% |
| French Canadians | 44.3 /100 | #177 | Average 84.3% |
| Northern Europeans | 44.1 /100 | #178 | Average 84.3% |
| Immigrants | South Africa | 42.8 /100 | #179 | Average 84.3% |
| Danes | 38.8 /100 | #180 | Fair 84.3% |
| Immigrants | West Indies | 36.4 /100 | #181 | Fair 84.3% |
| Koreans | 36.3 /100 | #182 | Fair 84.3% |
| Barbadians | 36.2 /100 | #183 | Fair 84.3% |
| Armenians | 35.6 /100 | #184 | Fair 84.3% |
Demographics Similar to Lumbee by In Labor Force | Age 35-44
In terms of in labor force | age 35-44, the demographic groups most similar to Lumbee are Hopi (77.0%, a difference of 0.050%), Yup'ik (77.3%, a difference of 0.35%), Pueblo (77.4%, a difference of 0.46%), Crow (76.5%, a difference of 0.69%), and Immigrants from Yemen (76.3%, a difference of 0.93%).
| Demographics | Rating | Rank | In Labor Force | Age 35-44 |
| Kiowa | 0.0 /100 | #333 | Tragic 79.2% |
| Yakama | 0.0 /100 | #334 | Tragic 79.0% |
| Natives/Alaskans | 0.0 /100 | #335 | Tragic 78.9% |
| Arapaho | 0.0 /100 | #336 | Tragic 78.1% |
| Apache | 0.0 /100 | #337 | Tragic 77.9% |
| Pueblo | 0.0 /100 | #338 | Tragic 77.4% |
| Yup'ik | 0.0 /100 | #339 | Tragic 77.3% |
| Lumbee | 0.0 /100 | #340 | Tragic 77.0% |
| Hopi | 0.0 /100 | #341 | Tragic 77.0% |
| Crow | 0.0 /100 | #342 | Tragic 76.5% |
| Immigrants | Yemen | 0.0 /100 | #343 | Tragic 76.3% |
| Pima | 0.0 /100 | #344 | Tragic 74.8% |
| Yuman | 0.0 /100 | #345 | Tragic 74.7% |
| Tohono O'odham | 0.0 /100 | #346 | Tragic 74.1% |
| Navajo | 0.0 /100 | #347 | Tragic 73.8% |