Pennsylvania German vs Immigrants from Cuba In Labor Force | Age 35-44
COMPARE
Pennsylvania German
Immigrants from Cuba
In Labor Force | Age 35-44
In Labor Force | Age 35-44 Comparison
Pennsylvania Germans
Immigrants from Cuba
82.9%
IN LABOR FORCE | AGE 35-44
0.0/ 100
METRIC RATING
291st/ 347
METRIC RANK
84.9%
IN LABOR FORCE | AGE 35-44
98.6/ 100
METRIC RATING
76th/ 347
METRIC RANK
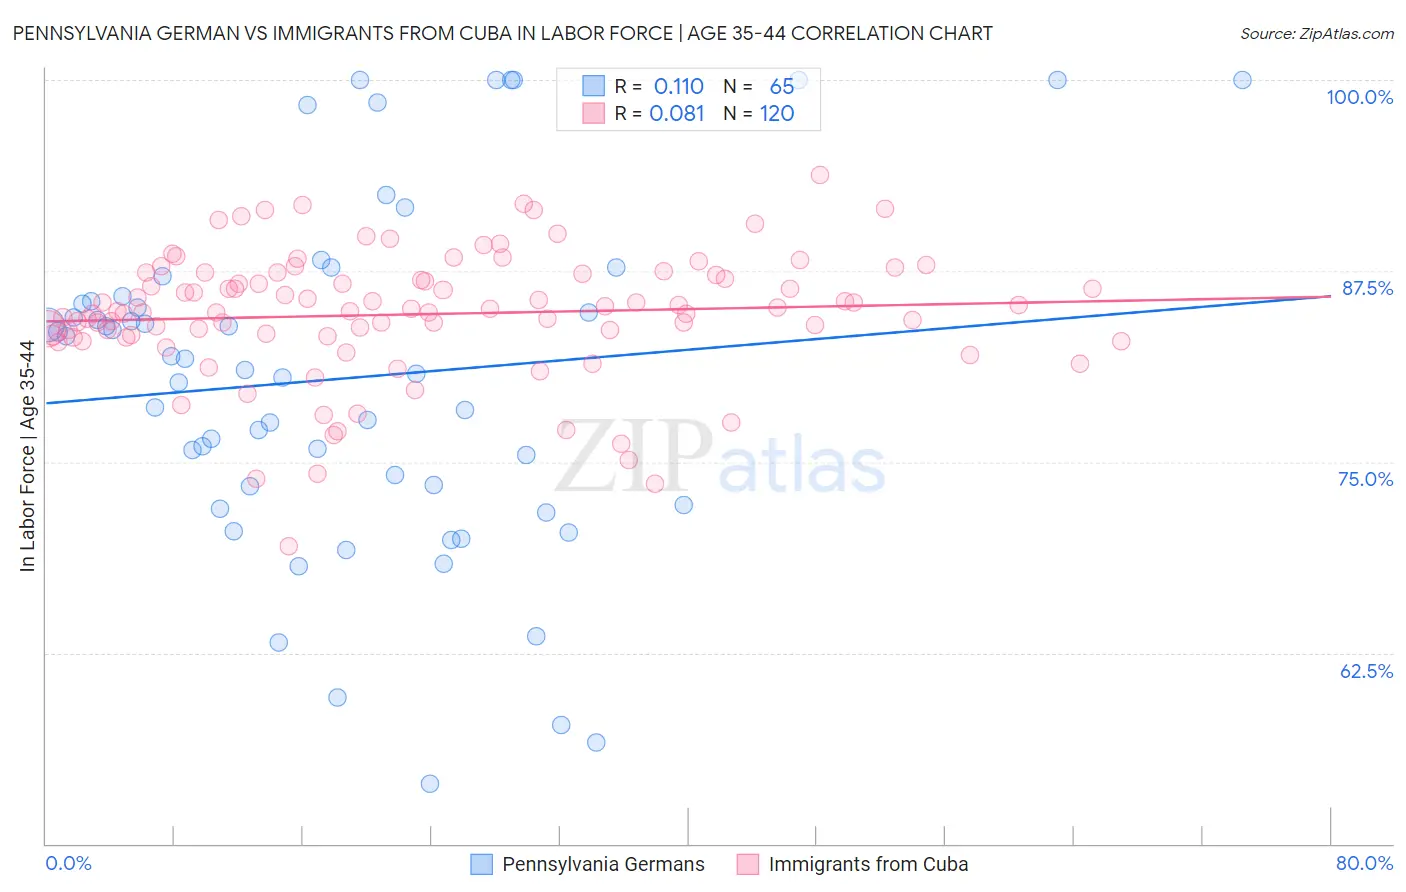
Pennsylvania German vs Immigrants from Cuba In Labor Force | Age 35-44 Correlation Chart
The statistical analysis conducted on geographies consisting of 234,051,901 people shows a poor positive correlation between the proportion of Pennsylvania Germans and labor force participation rate among population between the ages 35 and 44 in the United States with a correlation coefficient (R) of 0.110 and weighted average of 82.9%. Similarly, the statistical analysis conducted on geographies consisting of 325,923,342 people shows a slight positive correlation between the proportion of Immigrants from Cuba and labor force participation rate among population between the ages 35 and 44 in the United States with a correlation coefficient (R) of 0.081 and weighted average of 84.9%, a difference of 2.5%.
In Labor Force | Age 35-44 Correlation Summary
| Measurement | Pennsylvania German | Immigrants from Cuba |
| Minimum | 53.9% | 69.5% |
| Maximum | 100.0% | 93.8% |
| Range | 46.1% | 24.3% |
| Mean | 80.5% | 84.7% |
| Median | 81.0% | 85.0% |
| Interquartile 25% (IQ1) | 72.8% | 83.2% |
| Interquartile 75% (IQ3) | 85.7% | 87.3% |
| Interquartile Range (IQR) | 12.9% | 4.0% |
| Standard Deviation (Sample) | 11.3% | 4.2% |
| Standard Deviation (Population) | 11.2% | 4.1% |
Similar Demographics by In Labor Force | Age 35-44
Demographics Similar to Pennsylvania Germans by In Labor Force | Age 35-44
In terms of in labor force | age 35-44, the demographic groups most similar to Pennsylvania Germans are African (82.9%, a difference of 0.020%), Chippewa (82.9%, a difference of 0.030%), Puget Sound Salish (82.9%, a difference of 0.040%), Immigrants from Latin America (82.8%, a difference of 0.050%), and Fijian (82.9%, a difference of 0.060%).
| Demographics | Rating | Rank | In Labor Force | Age 35-44 |
| Immigrants | Dominican Republic | 0.0 /100 | #284 | Tragic 82.9% |
| Fijians | 0.0 /100 | #285 | Tragic 82.9% |
| Immigrants | Bangladesh | 0.0 /100 | #286 | Tragic 82.9% |
| Immigrants | Belize | 0.0 /100 | #287 | Tragic 82.9% |
| Puget Sound Salish | 0.0 /100 | #288 | Tragic 82.9% |
| Chippewa | 0.0 /100 | #289 | Tragic 82.9% |
| Africans | 0.0 /100 | #290 | Tragic 82.9% |
| Pennsylvania Germans | 0.0 /100 | #291 | Tragic 82.9% |
| Immigrants | Latin America | 0.0 /100 | #292 | Tragic 82.8% |
| Spanish Americans | 0.0 /100 | #293 | Tragic 82.8% |
| Potawatomi | 0.0 /100 | #294 | Tragic 82.7% |
| Immigrants | Lebanon | 0.0 /100 | #295 | Tragic 82.7% |
| Mexican American Indians | 0.0 /100 | #296 | Tragic 82.6% |
| Hmong | 0.0 /100 | #297 | Tragic 82.6% |
| Ottawa | 0.0 /100 | #298 | Tragic 82.6% |
Demographics Similar to Immigrants from Cuba by In Labor Force | Age 35-44
In terms of in labor force | age 35-44, the demographic groups most similar to Immigrants from Cuba are Immigrants from Turkey (84.9%, a difference of 0.0%), Immigrants from South Central Asia (85.0%, a difference of 0.010%), Colombian (85.0%, a difference of 0.020%), Immigrants from Singapore (85.0%, a difference of 0.030%), and Immigrants from Sri Lanka (85.0%, a difference of 0.030%).
| Demographics | Rating | Rank | In Labor Force | Age 35-44 |
| Sudanese | 99.0 /100 | #69 | Exceptional 85.0% |
| Brazilians | 99.0 /100 | #70 | Exceptional 85.0% |
| Russians | 99.0 /100 | #71 | Exceptional 85.0% |
| Immigrants | Singapore | 98.9 /100 | #72 | Exceptional 85.0% |
| Immigrants | Sri Lanka | 98.9 /100 | #73 | Exceptional 85.0% |
| Colombians | 98.8 /100 | #74 | Exceptional 85.0% |
| Immigrants | South Central Asia | 98.7 /100 | #75 | Exceptional 85.0% |
| Immigrants | Cuba | 98.6 /100 | #76 | Exceptional 84.9% |
| Immigrants | Turkey | 98.6 /100 | #77 | Exceptional 84.9% |
| Immigrants | Africa | 98.4 /100 | #78 | Exceptional 84.9% |
| Peruvians | 98.3 /100 | #79 | Exceptional 84.9% |
| Immigrants | Colombia | 98.3 /100 | #80 | Exceptional 84.9% |
| Immigrants | Eastern Europe | 98.3 /100 | #81 | Exceptional 84.9% |
| Immigrants | Sudan | 98.1 /100 | #82 | Exceptional 84.9% |
| Senegalese | 97.8 /100 | #83 | Exceptional 84.9% |