Pennsylvania German vs Czech In Labor Force | Age 35-44
COMPARE
Pennsylvania German
Czech
In Labor Force | Age 35-44
In Labor Force | Age 35-44 Comparison
Pennsylvania Germans
Czechs
82.9%
IN LABOR FORCE | AGE 35-44
0.0/ 100
METRIC RATING
291st/ 347
METRIC RANK
85.3%
IN LABOR FORCE | AGE 35-44
99.9/ 100
METRIC RATING
31st/ 347
METRIC RANK
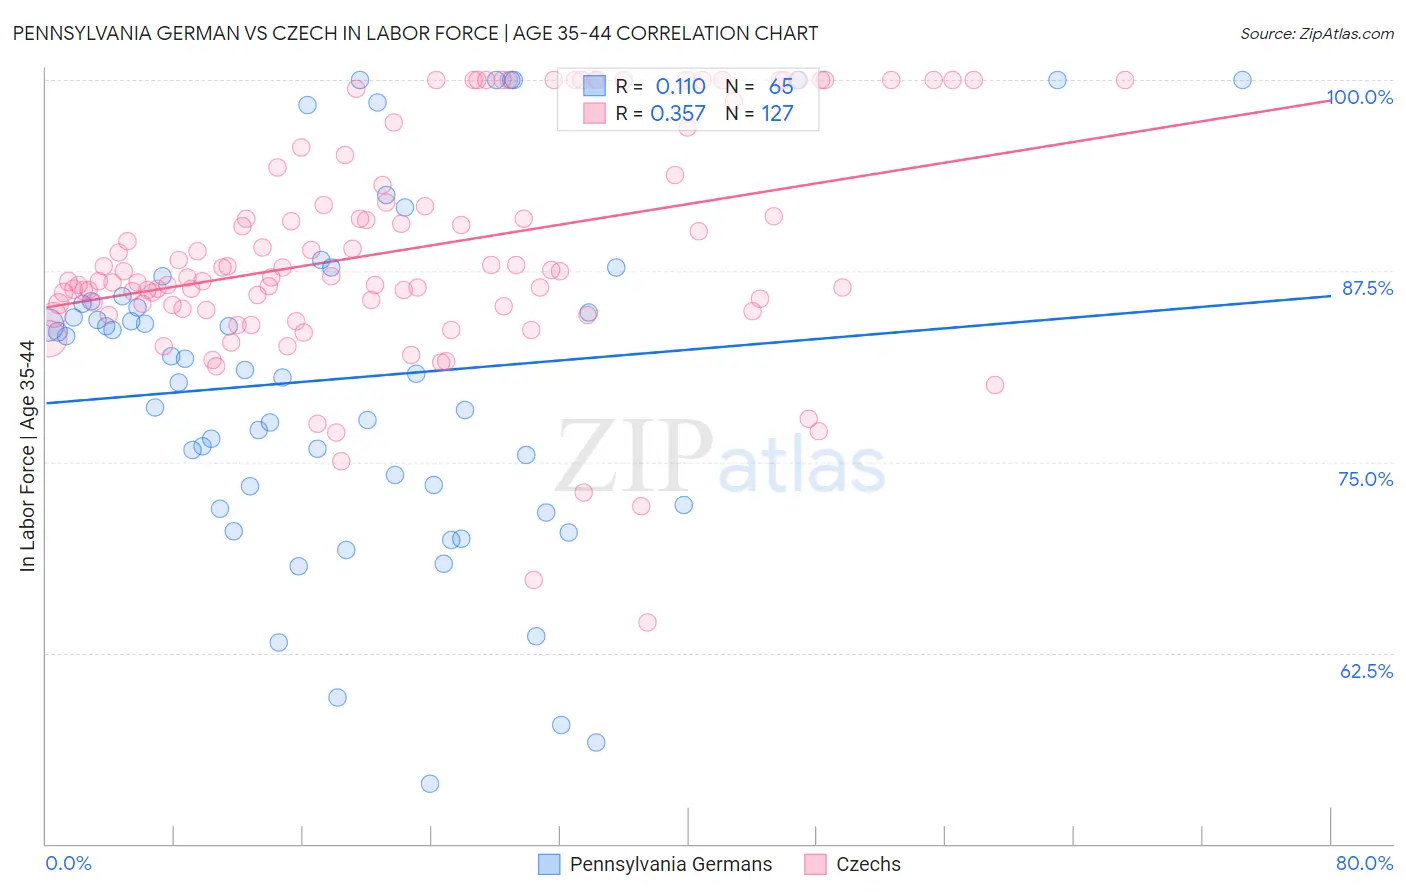
Pennsylvania German vs Czech In Labor Force | Age 35-44 Correlation Chart
The statistical analysis conducted on geographies consisting of 234,051,901 people shows a poor positive correlation between the proportion of Pennsylvania Germans and labor force participation rate among population between the ages 35 and 44 in the United States with a correlation coefficient (R) of 0.110 and weighted average of 82.9%. Similarly, the statistical analysis conducted on geographies consisting of 484,520,420 people shows a mild positive correlation between the proportion of Czechs and labor force participation rate among population between the ages 35 and 44 in the United States with a correlation coefficient (R) of 0.357 and weighted average of 85.3%, a difference of 2.9%.
In Labor Force | Age 35-44 Correlation Summary
| Measurement | Pennsylvania German | Czech |
| Minimum | 53.9% | 64.5% |
| Maximum | 100.0% | 100.0% |
| Range | 46.1% | 35.5% |
| Mean | 80.5% | 89.0% |
| Median | 81.0% | 87.1% |
| Interquartile 25% (IQ1) | 72.8% | 85.2% |
| Interquartile 75% (IQ3) | 85.7% | 94.3% |
| Interquartile Range (IQR) | 12.9% | 9.1% |
| Standard Deviation (Sample) | 11.3% | 7.4% |
| Standard Deviation (Population) | 11.2% | 7.4% |
Similar Demographics by In Labor Force | Age 35-44
Demographics Similar to Pennsylvania Germans by In Labor Force | Age 35-44
In terms of in labor force | age 35-44, the demographic groups most similar to Pennsylvania Germans are African (82.9%, a difference of 0.020%), Chippewa (82.9%, a difference of 0.030%), Puget Sound Salish (82.9%, a difference of 0.040%), Immigrants from Latin America (82.8%, a difference of 0.050%), and Fijian (82.9%, a difference of 0.060%).
| Demographics | Rating | Rank | In Labor Force | Age 35-44 |
| Immigrants | Dominican Republic | 0.0 /100 | #284 | Tragic 82.9% |
| Fijians | 0.0 /100 | #285 | Tragic 82.9% |
| Immigrants | Bangladesh | 0.0 /100 | #286 | Tragic 82.9% |
| Immigrants | Belize | 0.0 /100 | #287 | Tragic 82.9% |
| Puget Sound Salish | 0.0 /100 | #288 | Tragic 82.9% |
| Chippewa | 0.0 /100 | #289 | Tragic 82.9% |
| Africans | 0.0 /100 | #290 | Tragic 82.9% |
| Pennsylvania Germans | 0.0 /100 | #291 | Tragic 82.9% |
| Immigrants | Latin America | 0.0 /100 | #292 | Tragic 82.8% |
| Spanish Americans | 0.0 /100 | #293 | Tragic 82.8% |
| Potawatomi | 0.0 /100 | #294 | Tragic 82.7% |
| Immigrants | Lebanon | 0.0 /100 | #295 | Tragic 82.7% |
| Mexican American Indians | 0.0 /100 | #296 | Tragic 82.6% |
| Hmong | 0.0 /100 | #297 | Tragic 82.6% |
| Ottawa | 0.0 /100 | #298 | Tragic 82.6% |
Demographics Similar to Czechs by In Labor Force | Age 35-44
In terms of in labor force | age 35-44, the demographic groups most similar to Czechs are Bermudan (85.3%, a difference of 0.0%), Immigrants from India (85.3%, a difference of 0.0%), Ugandan (85.3%, a difference of 0.010%), Cambodian (85.3%, a difference of 0.020%), and Immigrants from Nepal (85.3%, a difference of 0.030%).
| Demographics | Rating | Rank | In Labor Force | Age 35-44 |
| Latvians | 99.9 /100 | #24 | Exceptional 85.4% |
| Paraguayans | 99.9 /100 | #25 | Exceptional 85.4% |
| Immigrants | Liberia | 99.9 /100 | #26 | Exceptional 85.4% |
| Immigrants | Lithuania | 99.9 /100 | #27 | Exceptional 85.4% |
| Immigrants | Greece | 99.9 /100 | #28 | Exceptional 85.3% |
| Cambodians | 99.9 /100 | #29 | Exceptional 85.3% |
| Bermudans | 99.9 /100 | #30 | Exceptional 85.3% |
| Czechs | 99.9 /100 | #31 | Exceptional 85.3% |
| Immigrants | India | 99.9 /100 | #32 | Exceptional 85.3% |
| Ugandans | 99.9 /100 | #33 | Exceptional 85.3% |
| Immigrants | Nepal | 99.9 /100 | #34 | Exceptional 85.3% |
| Estonians | 99.9 /100 | #35 | Exceptional 85.3% |
| Immigrants | Morocco | 99.8 /100 | #36 | Exceptional 85.2% |
| Kenyans | 99.8 /100 | #37 | Exceptional 85.2% |
| Immigrants | Poland | 99.8 /100 | #38 | Exceptional 85.2% |