Jamaican vs Irish In Labor Force | Age 35-44
COMPARE
Jamaican
Irish
In Labor Force | Age 35-44
In Labor Force | Age 35-44 Comparison
Jamaicans
Irish
84.4%
IN LABOR FORCE | AGE 35-44
62.7/ 100
METRIC RATING
158th/ 347
METRIC RANK
84.4%
IN LABOR FORCE | AGE 35-44
53.1/ 100
METRIC RATING
168th/ 347
METRIC RANK
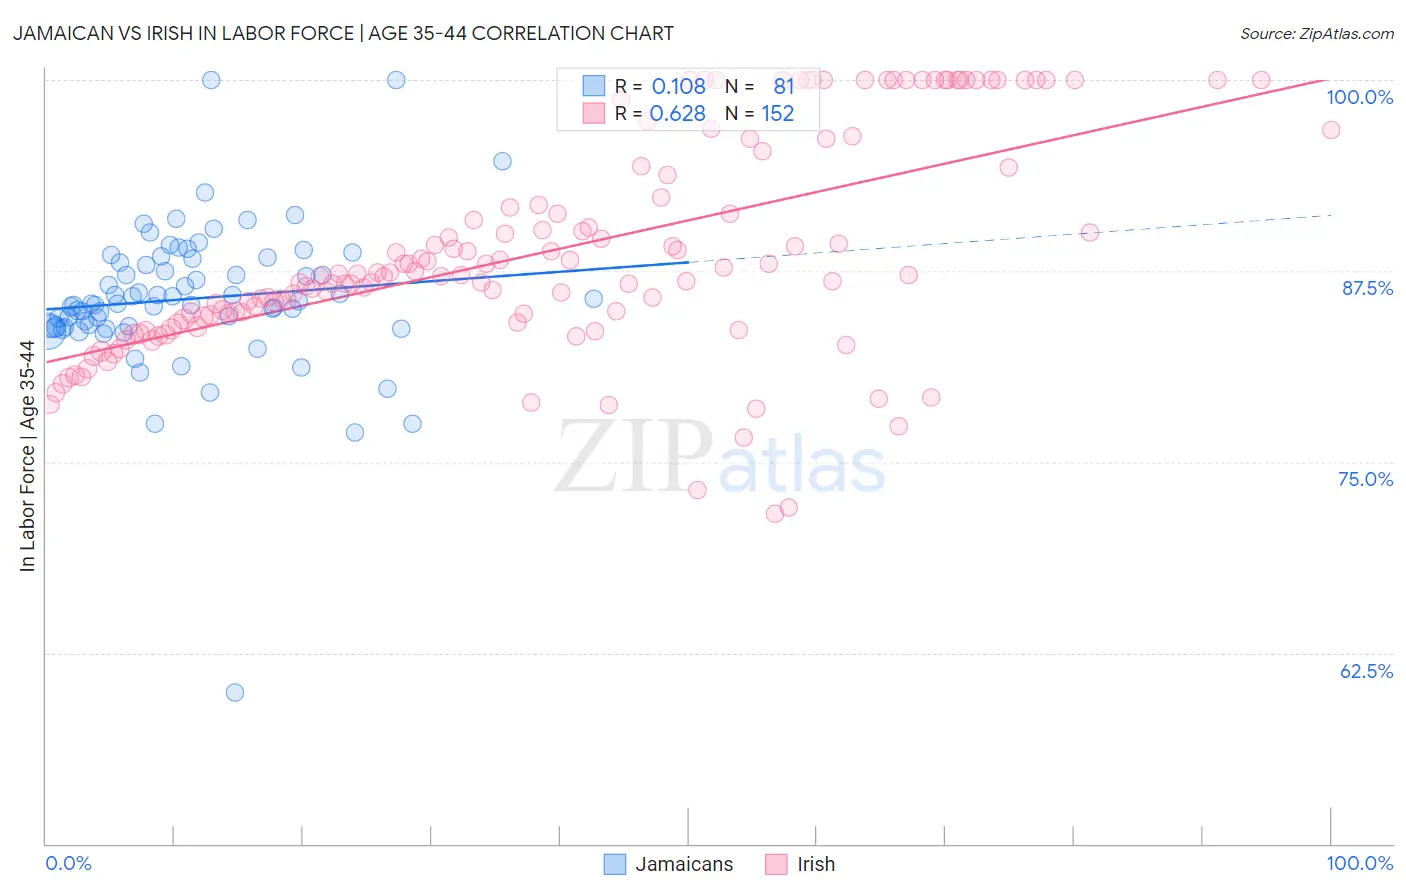
Jamaican vs Irish In Labor Force | Age 35-44 Correlation Chart
The statistical analysis conducted on geographies consisting of 367,727,365 people shows a poor positive correlation between the proportion of Jamaicans and labor force participation rate among population between the ages 35 and 44 in the United States with a correlation coefficient (R) of 0.108 and weighted average of 84.4%. Similarly, the statistical analysis conducted on geographies consisting of 579,649,730 people shows a significant positive correlation between the proportion of Irish and labor force participation rate among population between the ages 35 and 44 in the United States with a correlation coefficient (R) of 0.628 and weighted average of 84.4%, a difference of 0.060%.
In Labor Force | Age 35-44 Correlation Summary
| Measurement | Jamaican | Irish |
| Minimum | 59.9% | 71.6% |
| Maximum | 100.0% | 100.0% |
| Range | 40.1% | 28.4% |
| Mean | 85.7% | 88.8% |
| Median | 85.4% | 87.2% |
| Interquartile 25% (IQ1) | 83.8% | 84.4% |
| Interquartile 75% (IQ3) | 88.2% | 94.0% |
| Interquartile Range (IQR) | 4.3% | 9.6% |
| Standard Deviation (Sample) | 4.9% | 7.0% |
| Standard Deviation (Population) | 4.9% | 6.9% |
Demographics Similar to Jamaicans and Irish by In Labor Force | Age 35-44
In terms of in labor force | age 35-44, the demographic groups most similar to Jamaicans are Immigrants from Israel (84.4%, a difference of 0.010%), Immigrants from Austria (84.4%, a difference of 0.010%), Immigrants from Switzerland (84.5%, a difference of 0.020%), Immigrants from Senegal (84.4%, a difference of 0.020%), and Immigrants from Kazakhstan (84.4%, a difference of 0.020%). Similarly, the demographic groups most similar to Irish are Immigrants from Afghanistan (84.4%, a difference of 0.0%), Immigrants from Jordan (84.4%, a difference of 0.0%), Alsatian (84.4%, a difference of 0.010%), Immigrants from Portugal (84.4%, a difference of 0.010%), and Jordanian (84.4%, a difference of 0.010%).
| Demographics | Rating | Rank | In Labor Force | Age 35-44 |
| Trinidadians and Tobagonians | 69.5 /100 | #153 | Good 84.5% |
| Iranians | 69.4 /100 | #154 | Good 84.5% |
| Immigrants | Switzerland | 65.9 /100 | #155 | Good 84.5% |
| Immigrants | Israel | 64.3 /100 | #156 | Good 84.4% |
| Immigrants | Austria | 63.8 /100 | #157 | Good 84.4% |
| Jamaicans | 62.7 /100 | #158 | Good 84.4% |
| Immigrants | Senegal | 60.4 /100 | #159 | Good 84.4% |
| Immigrants | Kazakhstan | 60.4 /100 | #160 | Good 84.4% |
| Immigrants | Venezuela | 60.0 /100 | #161 | Good 84.4% |
| Immigrants | Hungary | 59.4 /100 | #162 | Average 84.4% |
| Aleuts | 59.1 /100 | #163 | Average 84.4% |
| Nigerians | 58.9 /100 | #164 | Average 84.4% |
| Venezuelans | 58.1 /100 | #165 | Average 84.4% |
| Alsatians | 55.2 /100 | #166 | Average 84.4% |
| Immigrants | Portugal | 55.2 /100 | #167 | Average 84.4% |
| Irish | 53.1 /100 | #168 | Average 84.4% |
| Immigrants | Afghanistan | 52.7 /100 | #169 | Average 84.4% |
| Immigrants | Jordan | 52.5 /100 | #170 | Average 84.4% |
| Jordanians | 51.7 /100 | #171 | Average 84.4% |
| Scandinavians | 51.2 /100 | #172 | Average 84.4% |
| Immigrants | Trinidad and Tobago | 50.7 /100 | #173 | Average 84.4% |