Czechoslovakian vs Irish In Labor Force | Age 35-44
COMPARE
Czechoslovakian
Irish
In Labor Force | Age 35-44
In Labor Force | Age 35-44 Comparison
Czechoslovakians
Irish
84.6%
IN LABOR FORCE | AGE 35-44
82.6/ 100
METRIC RATING
138th/ 347
METRIC RANK
84.4%
IN LABOR FORCE | AGE 35-44
53.1/ 100
METRIC RATING
168th/ 347
METRIC RANK
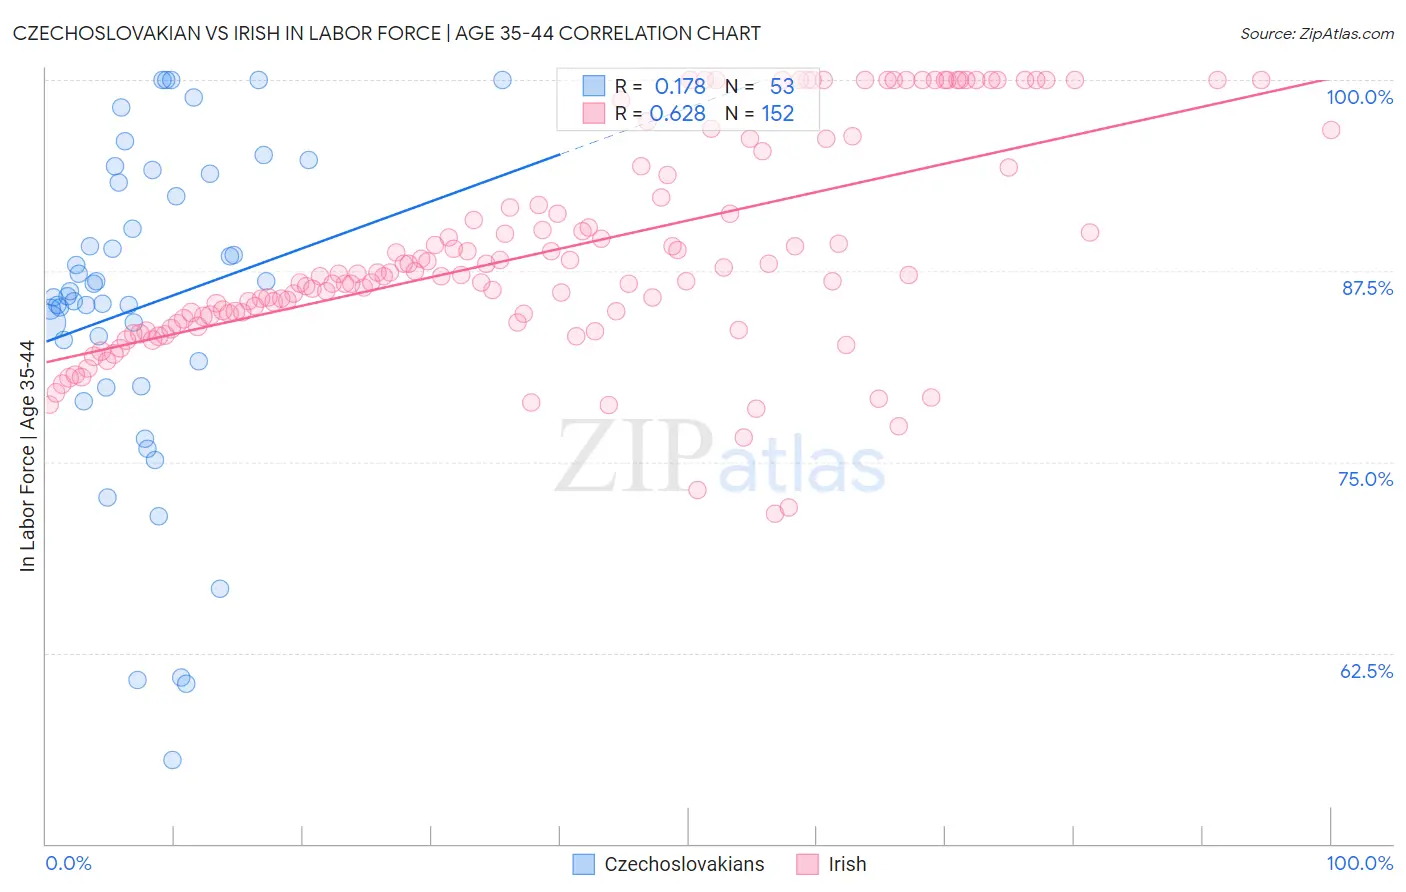
Czechoslovakian vs Irish In Labor Force | Age 35-44 Correlation Chart
The statistical analysis conducted on geographies consisting of 368,545,873 people shows a poor positive correlation between the proportion of Czechoslovakians and labor force participation rate among population between the ages 35 and 44 in the United States with a correlation coefficient (R) of 0.178 and weighted average of 84.6%. Similarly, the statistical analysis conducted on geographies consisting of 579,649,730 people shows a significant positive correlation between the proportion of Irish and labor force participation rate among population between the ages 35 and 44 in the United States with a correlation coefficient (R) of 0.628 and weighted average of 84.4%, a difference of 0.23%.
In Labor Force | Age 35-44 Correlation Summary
| Measurement | Czechoslovakian | Irish |
| Minimum | 55.5% | 71.6% |
| Maximum | 100.0% | 100.0% |
| Range | 44.5% | 28.4% |
| Mean | 85.2% | 88.8% |
| Median | 85.8% | 87.2% |
| Interquartile 25% (IQ1) | 80.8% | 84.4% |
| Interquartile 75% (IQ3) | 93.6% | 94.0% |
| Interquartile Range (IQR) | 12.8% | 9.6% |
| Standard Deviation (Sample) | 10.7% | 7.0% |
| Standard Deviation (Population) | 10.6% | 6.9% |
Similar Demographics by In Labor Force | Age 35-44
Demographics Similar to Czechoslovakians by In Labor Force | Age 35-44
In terms of in labor force | age 35-44, the demographic groups most similar to Czechoslovakians are Immigrants from Zaire (84.6%, a difference of 0.0%), Immigrants from Japan (84.6%, a difference of 0.010%), Immigrants from Chile (84.6%, a difference of 0.020%), Immigrants from Belgium (84.6%, a difference of 0.020%), and Immigrants from Uruguay (84.6%, a difference of 0.030%).
| Demographics | Rating | Rank | In Labor Force | Age 35-44 |
| Immigrants | Scotland | 89.6 /100 | #131 | Excellent 84.7% |
| Austrians | 89.4 /100 | #132 | Excellent 84.7% |
| Argentineans | 88.4 /100 | #133 | Excellent 84.6% |
| Immigrants | Korea | 88.2 /100 | #134 | Excellent 84.6% |
| Immigrants | Malaysia | 87.5 /100 | #135 | Excellent 84.6% |
| Afghans | 86.3 /100 | #136 | Excellent 84.6% |
| Immigrants | Chile | 84.6 /100 | #137 | Excellent 84.6% |
| Czechoslovakians | 82.6 /100 | #138 | Excellent 84.6% |
| Immigrants | Zaire | 82.5 /100 | #139 | Excellent 84.6% |
| Immigrants | Japan | 81.4 /100 | #140 | Excellent 84.6% |
| Immigrants | Belgium | 80.8 /100 | #141 | Excellent 84.6% |
| Immigrants | Uruguay | 80.1 /100 | #142 | Excellent 84.6% |
| Immigrants | Ukraine | 79.7 /100 | #143 | Good 84.6% |
| Immigrants | Jamaica | 79.4 /100 | #144 | Good 84.6% |
| Immigrants | Saudi Arabia | 79.4 /100 | #145 | Good 84.6% |
Demographics Similar to Irish by In Labor Force | Age 35-44
In terms of in labor force | age 35-44, the demographic groups most similar to Irish are Immigrants from Afghanistan (84.4%, a difference of 0.0%), Immigrants from Jordan (84.4%, a difference of 0.0%), Alsatian (84.4%, a difference of 0.010%), Immigrants from Portugal (84.4%, a difference of 0.010%), and Jordanian (84.4%, a difference of 0.010%).
| Demographics | Rating | Rank | In Labor Force | Age 35-44 |
| Immigrants | Venezuela | 60.0 /100 | #161 | Good 84.4% |
| Immigrants | Hungary | 59.4 /100 | #162 | Average 84.4% |
| Aleuts | 59.1 /100 | #163 | Average 84.4% |
| Nigerians | 58.9 /100 | #164 | Average 84.4% |
| Venezuelans | 58.1 /100 | #165 | Average 84.4% |
| Alsatians | 55.2 /100 | #166 | Average 84.4% |
| Immigrants | Portugal | 55.2 /100 | #167 | Average 84.4% |
| Irish | 53.1 /100 | #168 | Average 84.4% |
| Immigrants | Afghanistan | 52.7 /100 | #169 | Average 84.4% |
| Immigrants | Jordan | 52.5 /100 | #170 | Average 84.4% |
| Jordanians | 51.7 /100 | #171 | Average 84.4% |
| Scandinavians | 51.2 /100 | #172 | Average 84.4% |
| Immigrants | Trinidad and Tobago | 50.7 /100 | #173 | Average 84.4% |
| Immigrants | Iran | 50.0 /100 | #174 | Average 84.4% |
| Pakistanis | 48.2 /100 | #175 | Average 84.4% |