Osage vs Cuban In Labor Force | Age 20-64
COMPARE
Osage
Cuban
In Labor Force | Age 20-64
In Labor Force | Age 20-64 Comparison
Osage
Cubans
78.0%
IN LABOR FORCE | AGE 20-64
0.0/ 100
METRIC RATING
285th/ 347
METRIC RANK
79.5%
IN LABOR FORCE | AGE 20-64
46.1/ 100
METRIC RATING
175th/ 347
METRIC RANK
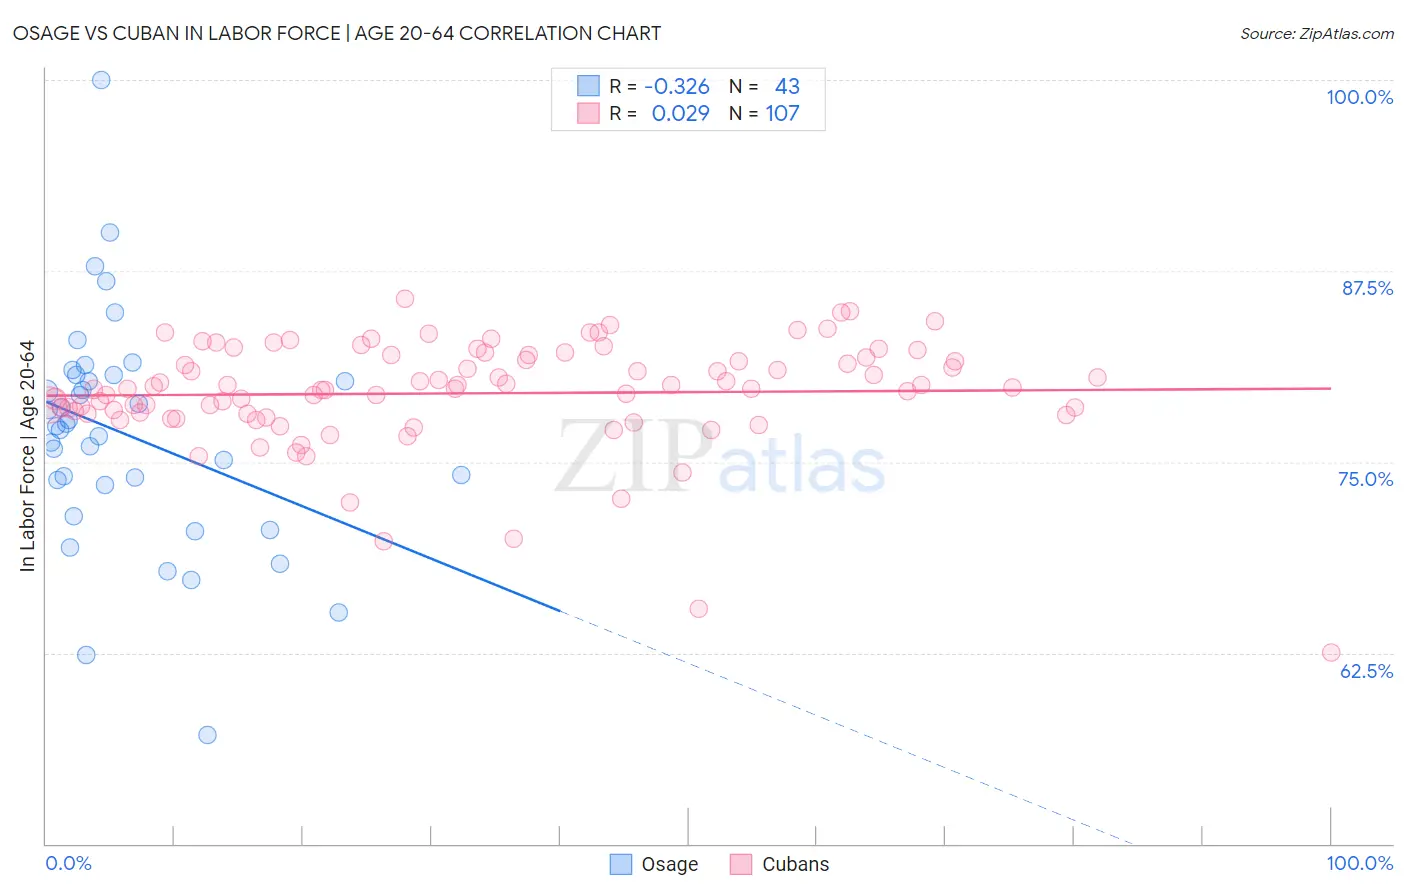
Osage vs Cuban In Labor Force | Age 20-64 Correlation Chart
The statistical analysis conducted on geographies consisting of 91,799,408 people shows a mild negative correlation between the proportion of Osage and labor force participation rate among population between the ages 20 and 64 in the United States with a correlation coefficient (R) of -0.326 and weighted average of 78.0%. Similarly, the statistical analysis conducted on geographies consisting of 449,374,603 people shows no correlation between the proportion of Cubans and labor force participation rate among population between the ages 20 and 64 in the United States with a correlation coefficient (R) of 0.029 and weighted average of 79.5%, a difference of 2.0%.
In Labor Force | Age 20-64 Correlation Summary
| Measurement | Osage | Cuban |
| Minimum | 57.1% | 62.5% |
| Maximum | 100.0% | 85.7% |
| Range | 42.9% | 23.2% |
| Mean | 76.8% | 79.5% |
| Median | 77.4% | 79.8% |
| Interquartile 25% (IQ1) | 73.5% | 78.1% |
| Interquartile 75% (IQ3) | 80.7% | 82.0% |
| Interquartile Range (IQR) | 7.2% | 3.9% |
| Standard Deviation (Sample) | 7.5% | 3.6% |
| Standard Deviation (Population) | 7.4% | 3.6% |
Similar Demographics by In Labor Force | Age 20-64
Demographics Similar to Osage by In Labor Force | Age 20-64
In terms of in labor force | age 20-64, the demographic groups most similar to Osage are Immigrants from Belize (78.0%, a difference of 0.010%), Vietnamese (78.0%, a difference of 0.010%), Hmong (77.9%, a difference of 0.090%), Immigrants from Guyana (78.1%, a difference of 0.10%), and African (77.9%, a difference of 0.10%).
| Demographics | Rating | Rank | In Labor Force | Age 20-64 |
| Mexican American Indians | 0.0 /100 | #278 | Tragic 78.2% |
| Belizeans | 0.0 /100 | #279 | Tragic 78.2% |
| Immigrants | Dominica | 0.0 /100 | #280 | Tragic 78.1% |
| Guyanese | 0.0 /100 | #281 | Tragic 78.1% |
| Immigrants | St. Vincent and the Grenadines | 0.0 /100 | #282 | Tragic 78.1% |
| Immigrants | Nonimmigrants | 0.0 /100 | #283 | Tragic 78.1% |
| Immigrants | Guyana | 0.0 /100 | #284 | Tragic 78.1% |
| Osage | 0.0 /100 | #285 | Tragic 78.0% |
| Immigrants | Belize | 0.0 /100 | #286 | Tragic 78.0% |
| Vietnamese | 0.0 /100 | #287 | Tragic 78.0% |
| Hmong | 0.0 /100 | #288 | Tragic 77.9% |
| Africans | 0.0 /100 | #289 | Tragic 77.9% |
| Immigrants | Bangladesh | 0.0 /100 | #290 | Tragic 77.9% |
| Spanish Americans | 0.0 /100 | #291 | Tragic 77.8% |
| Immigrants | Azores | 0.0 /100 | #292 | Tragic 77.8% |
Demographics Similar to Cubans by In Labor Force | Age 20-64
In terms of in labor force | age 20-64, the demographic groups most similar to Cubans are Australian (79.5%, a difference of 0.0%), Immigrants from Netherlands (79.5%, a difference of 0.010%), Czechoslovakian (79.5%, a difference of 0.010%), Syrian (79.6%, a difference of 0.030%), and Armenian (79.5%, a difference of 0.040%).
| Demographics | Rating | Rank | In Labor Force | Age 20-64 |
| Immigrants | Indonesia | 61.8 /100 | #168 | Good 79.6% |
| Laotians | 58.4 /100 | #169 | Average 79.6% |
| Slavs | 54.0 /100 | #170 | Average 79.6% |
| Immigrants | Switzerland | 53.3 /100 | #171 | Average 79.6% |
| Immigrants | Belgium | 53.1 /100 | #172 | Average 79.6% |
| Immigrants | Scotland | 52.4 /100 | #173 | Average 79.6% |
| Syrians | 50.0 /100 | #174 | Average 79.6% |
| Cubans | 46.1 /100 | #175 | Average 79.5% |
| Australians | 46.0 /100 | #176 | Average 79.5% |
| Immigrants | Netherlands | 45.2 /100 | #177 | Average 79.5% |
| Czechoslovakians | 44.3 /100 | #178 | Average 79.5% |
| Armenians | 41.4 /100 | #179 | Average 79.5% |
| Salvadorans | 41.0 /100 | #180 | Average 79.5% |
| Immigrants | Saudi Arabia | 37.7 /100 | #181 | Fair 79.5% |
| Malaysians | 37.1 /100 | #182 | Fair 79.5% |