Osage vs Bahamian In Labor Force | Age 20-64
COMPARE
Osage
Bahamian
In Labor Force | Age 20-64
In Labor Force | Age 20-64 Comparison
Osage
Bahamians
78.0%
IN LABOR FORCE | AGE 20-64
0.0/ 100
METRIC RATING
285th/ 347
METRIC RANK
78.4%
IN LABOR FORCE | AGE 20-64
0.1/ 100
METRIC RATING
266th/ 347
METRIC RANK
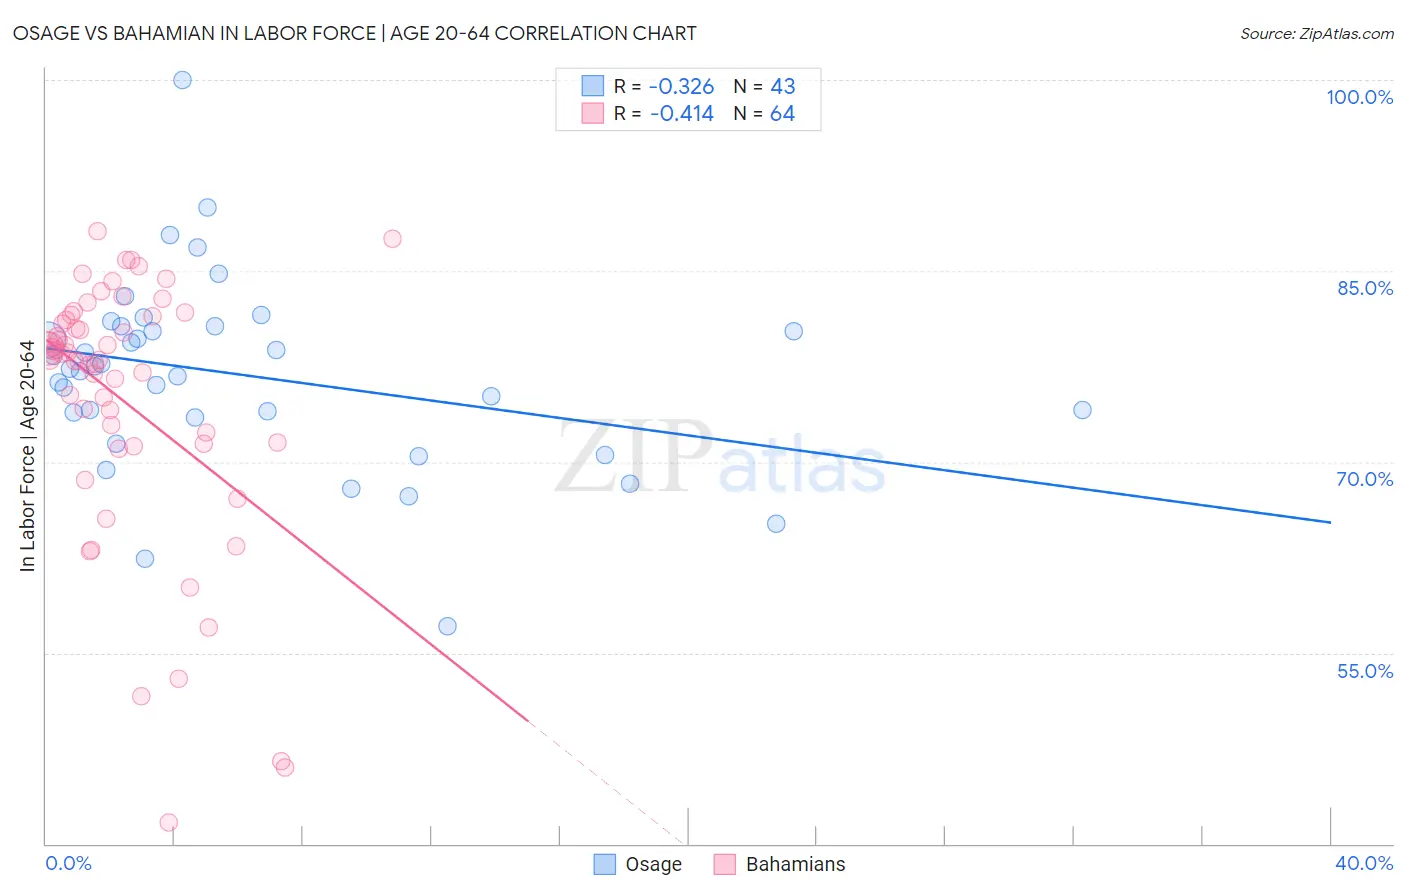
Osage vs Bahamian In Labor Force | Age 20-64 Correlation Chart
The statistical analysis conducted on geographies consisting of 91,799,408 people shows a mild negative correlation between the proportion of Osage and labor force participation rate among population between the ages 20 and 64 in the United States with a correlation coefficient (R) of -0.326 and weighted average of 78.0%. Similarly, the statistical analysis conducted on geographies consisting of 112,707,980 people shows a moderate negative correlation between the proportion of Bahamians and labor force participation rate among population between the ages 20 and 64 in the United States with a correlation coefficient (R) of -0.414 and weighted average of 78.4%, a difference of 0.51%.
In Labor Force | Age 20-64 Correlation Summary
| Measurement | Osage | Bahamian |
| Minimum | 57.1% | 41.7% |
| Maximum | 100.0% | 88.1% |
| Range | 42.9% | 46.4% |
| Mean | 76.8% | 74.8% |
| Median | 77.4% | 78.3% |
| Interquartile 25% (IQ1) | 73.5% | 71.5% |
| Interquartile 75% (IQ3) | 80.7% | 81.3% |
| Interquartile Range (IQR) | 7.2% | 9.8% |
| Standard Deviation (Sample) | 7.5% | 10.4% |
| Standard Deviation (Population) | 7.4% | 10.3% |
Demographics Similar to Osage and Bahamians by In Labor Force | Age 20-64
In terms of in labor force | age 20-64, the demographic groups most similar to Osage are Immigrants from Guyana (78.1%, a difference of 0.10%), Nonimmigrants (78.1%, a difference of 0.11%), Immigrants from St. Vincent and the Grenadines (78.1%, a difference of 0.13%), Guyanese (78.1%, a difference of 0.15%), and Immigrants from Dominica (78.1%, a difference of 0.18%). Similarly, the demographic groups most similar to Bahamians are British West Indian (78.4%, a difference of 0.010%), U.S. Virgin Islander (78.4%, a difference of 0.020%), West Indian (78.3%, a difference of 0.040%), Immigrants from Barbados (78.3%, a difference of 0.090%), and Scotch-Irish (78.3%, a difference of 0.12%).
| Demographics | Rating | Rank | In Labor Force | Age 20-64 |
| British West Indians | 0.1 /100 | #265 | Tragic 78.4% |
| Bahamians | 0.1 /100 | #266 | Tragic 78.4% |
| U.S. Virgin Islanders | 0.1 /100 | #267 | Tragic 78.4% |
| West Indians | 0.0 /100 | #268 | Tragic 78.3% |
| Immigrants | Barbados | 0.0 /100 | #269 | Tragic 78.3% |
| Scotch-Irish | 0.0 /100 | #270 | Tragic 78.3% |
| Immigrants | Latin America | 0.0 /100 | #271 | Tragic 78.3% |
| Marshallese | 0.0 /100 | #272 | Tragic 78.3% |
| French American Indians | 0.0 /100 | #273 | Tragic 78.2% |
| Aleuts | 0.0 /100 | #274 | Tragic 78.2% |
| Spanish | 0.0 /100 | #275 | Tragic 78.2% |
| Puget Sound Salish | 0.0 /100 | #276 | Tragic 78.2% |
| Immigrants | Bahamas | 0.0 /100 | #277 | Tragic 78.2% |
| Mexican American Indians | 0.0 /100 | #278 | Tragic 78.2% |
| Belizeans | 0.0 /100 | #279 | Tragic 78.2% |
| Immigrants | Dominica | 0.0 /100 | #280 | Tragic 78.1% |
| Guyanese | 0.0 /100 | #281 | Tragic 78.1% |
| Immigrants | St. Vincent and the Grenadines | 0.0 /100 | #282 | Tragic 78.1% |
| Immigrants | Nonimmigrants | 0.0 /100 | #283 | Tragic 78.1% |
| Immigrants | Guyana | 0.0 /100 | #284 | Tragic 78.1% |
| Osage | 0.0 /100 | #285 | Tragic 78.0% |