Osage vs Barbadian In Labor Force | Age 20-64
COMPARE
Osage
Barbadian
In Labor Force | Age 20-64
In Labor Force | Age 20-64 Comparison
Osage
Barbadians
78.0%
IN LABOR FORCE | AGE 20-64
0.0/ 100
METRIC RATING
285th/ 347
METRIC RANK
78.8%
IN LABOR FORCE | AGE 20-64
0.7/ 100
METRIC RATING
251st/ 347
METRIC RANK
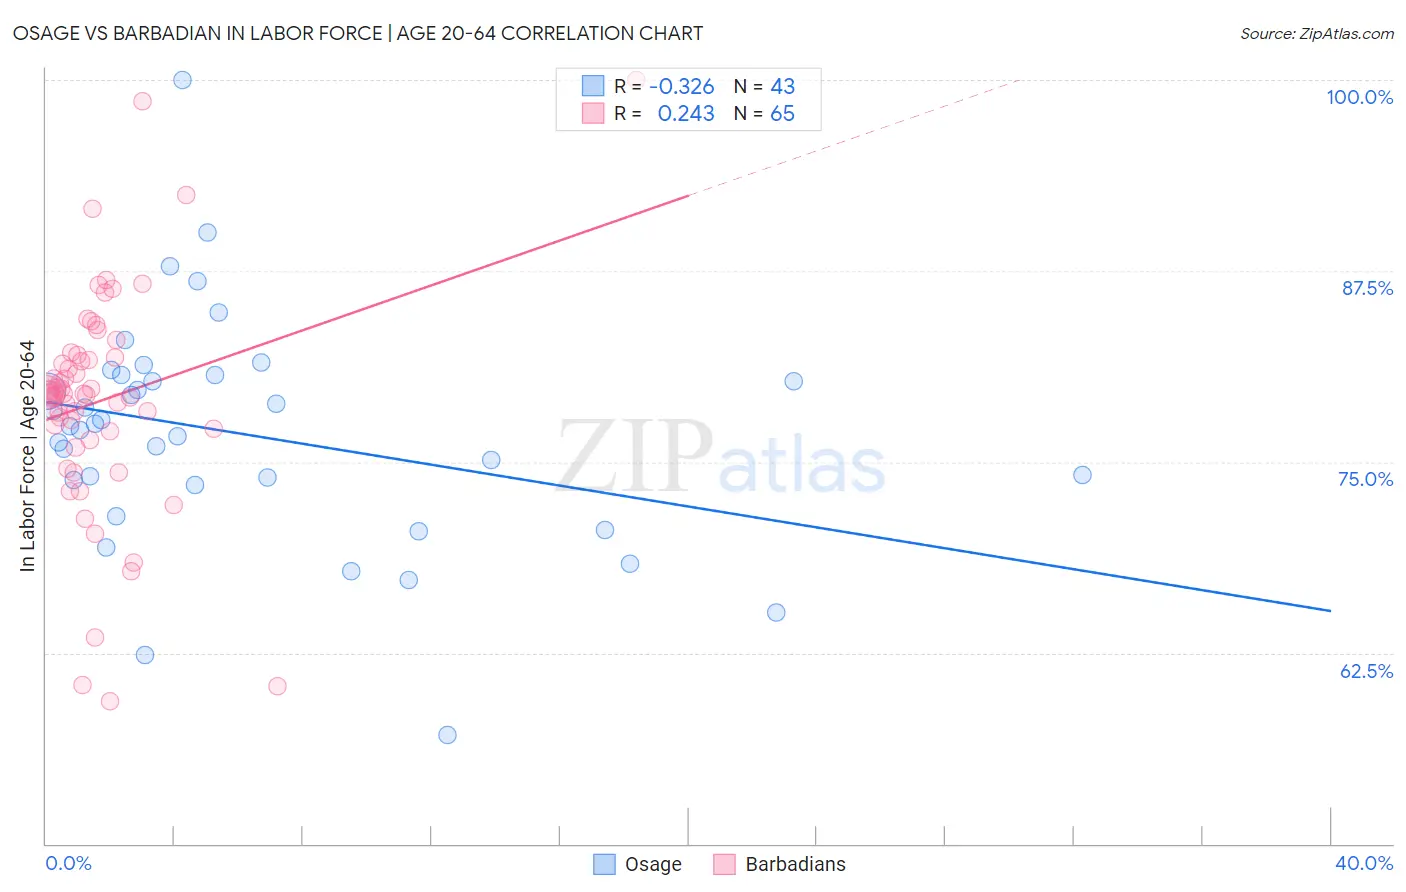
Osage vs Barbadian In Labor Force | Age 20-64 Correlation Chart
The statistical analysis conducted on geographies consisting of 91,799,408 people shows a mild negative correlation between the proportion of Osage and labor force participation rate among population between the ages 20 and 64 in the United States with a correlation coefficient (R) of -0.326 and weighted average of 78.0%. Similarly, the statistical analysis conducted on geographies consisting of 141,304,311 people shows a weak positive correlation between the proportion of Barbadians and labor force participation rate among population between the ages 20 and 64 in the United States with a correlation coefficient (R) of 0.243 and weighted average of 78.8%, a difference of 1.0%.
In Labor Force | Age 20-64 Correlation Summary
| Measurement | Osage | Barbadian |
| Minimum | 57.1% | 59.3% |
| Maximum | 100.0% | 100.0% |
| Range | 42.9% | 40.7% |
| Mean | 76.8% | 79.0% |
| Median | 77.4% | 79.4% |
| Interquartile 25% (IQ1) | 73.5% | 76.7% |
| Interquartile 75% (IQ3) | 80.7% | 81.9% |
| Interquartile Range (IQR) | 7.2% | 5.2% |
| Standard Deviation (Sample) | 7.5% | 7.4% |
| Standard Deviation (Population) | 7.4% | 7.4% |
Similar Demographics by In Labor Force | Age 20-64
Demographics Similar to Osage by In Labor Force | Age 20-64
In terms of in labor force | age 20-64, the demographic groups most similar to Osage are Immigrants from Belize (78.0%, a difference of 0.010%), Vietnamese (78.0%, a difference of 0.010%), Hmong (77.9%, a difference of 0.090%), Immigrants from Guyana (78.1%, a difference of 0.10%), and African (77.9%, a difference of 0.10%).
| Demographics | Rating | Rank | In Labor Force | Age 20-64 |
| Mexican American Indians | 0.0 /100 | #278 | Tragic 78.2% |
| Belizeans | 0.0 /100 | #279 | Tragic 78.2% |
| Immigrants | Dominica | 0.0 /100 | #280 | Tragic 78.1% |
| Guyanese | 0.0 /100 | #281 | Tragic 78.1% |
| Immigrants | St. Vincent and the Grenadines | 0.0 /100 | #282 | Tragic 78.1% |
| Immigrants | Nonimmigrants | 0.0 /100 | #283 | Tragic 78.1% |
| Immigrants | Guyana | 0.0 /100 | #284 | Tragic 78.1% |
| Osage | 0.0 /100 | #285 | Tragic 78.0% |
| Immigrants | Belize | 0.0 /100 | #286 | Tragic 78.0% |
| Vietnamese | 0.0 /100 | #287 | Tragic 78.0% |
| Hmong | 0.0 /100 | #288 | Tragic 77.9% |
| Africans | 0.0 /100 | #289 | Tragic 77.9% |
| Immigrants | Bangladesh | 0.0 /100 | #290 | Tragic 77.9% |
| Spanish Americans | 0.0 /100 | #291 | Tragic 77.8% |
| Immigrants | Azores | 0.0 /100 | #292 | Tragic 77.8% |
Demographics Similar to Barbadians by In Labor Force | Age 20-64
In terms of in labor force | age 20-64, the demographic groups most similar to Barbadians are English (78.8%, a difference of 0.030%), Honduran (78.8%, a difference of 0.030%), Immigrants from Honduras (78.7%, a difference of 0.050%), Immigrants from Germany (78.8%, a difference of 0.060%), and Immigrants from Caribbean (78.8%, a difference of 0.060%).
| Demographics | Rating | Rank | In Labor Force | Age 20-64 |
| French | 1.5 /100 | #244 | Tragic 78.9% |
| Scottish | 1.3 /100 | #245 | Tragic 78.9% |
| Immigrants | Trinidad and Tobago | 1.1 /100 | #246 | Tragic 78.8% |
| Immigrants | Germany | 1.0 /100 | #247 | Tragic 78.8% |
| Immigrants | Caribbean | 1.0 /100 | #248 | Tragic 78.8% |
| English | 0.9 /100 | #249 | Tragic 78.8% |
| Hondurans | 0.8 /100 | #250 | Tragic 78.8% |
| Barbadians | 0.7 /100 | #251 | Tragic 78.8% |
| Immigrants | Honduras | 0.6 /100 | #252 | Tragic 78.7% |
| Basques | 0.5 /100 | #253 | Tragic 78.7% |
| Immigrants | Lebanon | 0.5 /100 | #254 | Tragic 78.7% |
| Hawaiians | 0.5 /100 | #255 | Tragic 78.7% |
| Celtics | 0.5 /100 | #256 | Tragic 78.7% |
| Guatemalans | 0.4 /100 | #257 | Tragic 78.7% |
| Immigrants | Guatemala | 0.4 /100 | #258 | Tragic 78.7% |