Navajo vs Czechoslovakian In Labor Force | Age 16-19
COMPARE
Navajo
Czechoslovakian
In Labor Force | Age 16-19
In Labor Force | Age 16-19 Comparison
Navajo
Czechoslovakians
32.1%
IN LABOR FORCE | AGE 16-19
0.0/ 100
METRIC RATING
308th/ 347
METRIC RANK
41.9%
IN LABOR FORCE | AGE 16-19
100.0/ 100
METRIC RATING
32nd/ 347
METRIC RANK
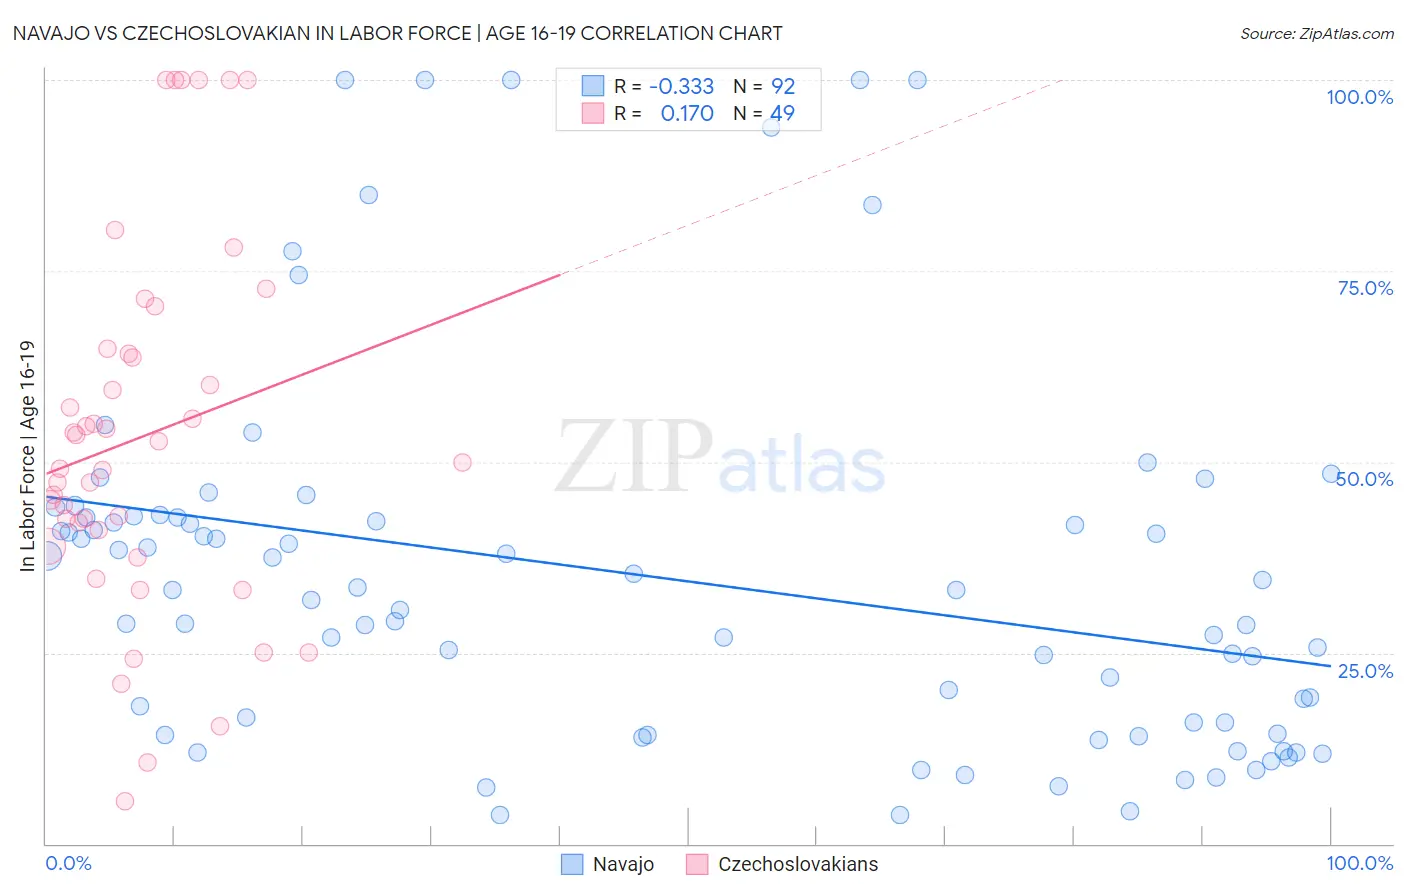
Navajo vs Czechoslovakian In Labor Force | Age 16-19 Correlation Chart
The statistical analysis conducted on geographies consisting of 224,572,215 people shows a mild negative correlation between the proportion of Navajo and labor force participation rate among population between the ages 16 and 19 in the United States with a correlation coefficient (R) of -0.333 and weighted average of 32.1%. Similarly, the statistical analysis conducted on geographies consisting of 368,118,487 people shows a poor positive correlation between the proportion of Czechoslovakians and labor force participation rate among population between the ages 16 and 19 in the United States with a correlation coefficient (R) of 0.170 and weighted average of 41.9%, a difference of 30.5%.
In Labor Force | Age 16-19 Correlation Summary
| Measurement | Navajo | Czechoslovakian |
| Minimum | 3.8% | 5.6% |
| Maximum | 100.0% | 100.0% |
| Range | 96.2% | 94.4% |
| Mean | 35.0% | 53.4% |
| Median | 32.6% | 50.0% |
| Interquartile 25% (IQ1) | 15.1% | 40.0% |
| Interquartile 75% (IQ3) | 42.8% | 64.5% |
| Interquartile Range (IQR) | 27.6% | 24.5% |
| Standard Deviation (Sample) | 24.1% | 23.9% |
| Standard Deviation (Population) | 24.0% | 23.7% |
Similar Demographics by In Labor Force | Age 16-19
Demographics Similar to Navajo by In Labor Force | Age 16-19
In terms of in labor force | age 16-19, the demographic groups most similar to Navajo are Immigrants from Eastern Asia (32.0%, a difference of 0.18%), Immigrants from Iran (32.0%, a difference of 0.32%), Immigrants from Jamaica (32.2%, a difference of 0.35%), Indian (Asian) (31.9%, a difference of 0.68%), and Immigrants from Belize (31.8%, a difference of 0.83%).
| Demographics | Rating | Rank | In Labor Force | Age 16-19 |
| Okinawans | 0.0 /100 | #301 | Tragic 32.8% |
| Belizeans | 0.0 /100 | #302 | Tragic 32.8% |
| Immigrants | Dominica | 0.0 /100 | #303 | Tragic 32.5% |
| Israelis | 0.0 /100 | #304 | Tragic 32.4% |
| Nicaraguans | 0.0 /100 | #305 | Tragic 32.4% |
| Spanish American Indians | 0.0 /100 | #306 | Tragic 32.4% |
| Immigrants | Jamaica | 0.0 /100 | #307 | Tragic 32.2% |
| Navajo | 0.0 /100 | #308 | Tragic 32.1% |
| Immigrants | Eastern Asia | 0.0 /100 | #309 | Tragic 32.0% |
| Immigrants | Iran | 0.0 /100 | #310 | Tragic 32.0% |
| Indians (Asian) | 0.0 /100 | #311 | Tragic 31.9% |
| Immigrants | Belize | 0.0 /100 | #312 | Tragic 31.8% |
| Hopi | 0.0 /100 | #313 | Tragic 31.8% |
| Cubans | 0.0 /100 | #314 | Tragic 31.8% |
| Immigrants | West Indies | 0.0 /100 | #315 | Tragic 31.7% |
Demographics Similar to Czechoslovakians by In Labor Force | Age 16-19
In terms of in labor force | age 16-19, the demographic groups most similar to Czechoslovakians are Liberian (41.8%, a difference of 0.14%), Irish (42.0%, a difference of 0.20%), Immigrants from Bosnia and Herzegovina (41.8%, a difference of 0.22%), Yugoslavian (41.8%, a difference of 0.24%), and Scottish (42.0%, a difference of 0.27%).
| Demographics | Rating | Rank | In Labor Force | Age 16-19 |
| German Russians | 100.0 /100 | #25 | Exceptional 42.4% |
| English | 100.0 /100 | #26 | Exceptional 42.4% |
| Welsh | 100.0 /100 | #27 | Exceptional 42.3% |
| Poles | 100.0 /100 | #28 | Exceptional 42.1% |
| French | 100.0 /100 | #29 | Exceptional 42.1% |
| Scottish | 100.0 /100 | #30 | Exceptional 42.0% |
| Irish | 100.0 /100 | #31 | Exceptional 42.0% |
| Czechoslovakians | 100.0 /100 | #32 | Exceptional 41.9% |
| Liberians | 100.0 /100 | #33 | Exceptional 41.8% |
| Immigrants | Bosnia and Herzegovina | 100.0 /100 | #34 | Exceptional 41.8% |
| Yugoslavians | 100.0 /100 | #35 | Exceptional 41.8% |
| Immigrants | Azores | 100.0 /100 | #36 | Exceptional 41.7% |
| Immigrants | Congo | 100.0 /100 | #37 | Exceptional 41.7% |
| Sioux | 100.0 /100 | #38 | Exceptional 41.5% |
| Scotch-Irish | 100.0 /100 | #39 | Exceptional 41.5% |