Immigrants from Bahamas vs Immigrants from Hong Kong In Labor Force | Age 16-19
COMPARE
Immigrants from Bahamas
Immigrants from Hong Kong
In Labor Force | Age 16-19
In Labor Force | Age 16-19 Comparison
Immigrants from Bahamas
Immigrants from Hong Kong
35.5%
IN LABOR FORCE | AGE 16-19
8.3/ 100
METRIC RATING
220th/ 347
METRIC RANK
30.5%
IN LABOR FORCE | AGE 16-19
0.0/ 100
METRIC RATING
333rd/ 347
METRIC RANK
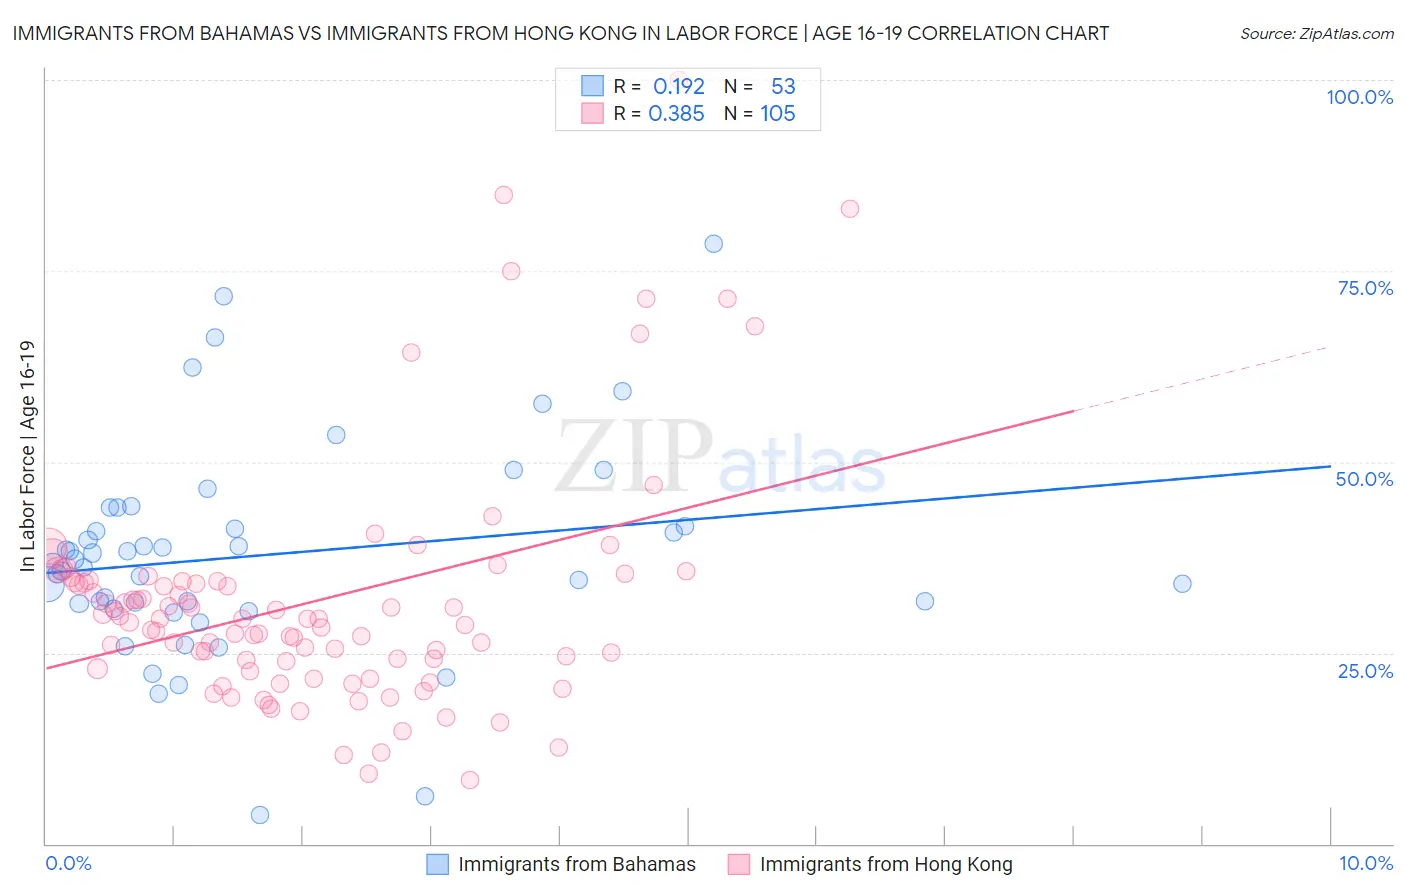
Immigrants from Bahamas vs Immigrants from Hong Kong In Labor Force | Age 16-19 Correlation Chart
The statistical analysis conducted on geographies consisting of 104,625,160 people shows a poor positive correlation between the proportion of Immigrants from Bahamas and labor force participation rate among population between the ages 16 and 19 in the United States with a correlation coefficient (R) of 0.192 and weighted average of 35.5%. Similarly, the statistical analysis conducted on geographies consisting of 253,714,019 people shows a mild positive correlation between the proportion of Immigrants from Hong Kong and labor force participation rate among population between the ages 16 and 19 in the United States with a correlation coefficient (R) of 0.385 and weighted average of 30.5%, a difference of 16.4%.
In Labor Force | Age 16-19 Correlation Summary
| Measurement | Immigrants from Bahamas | Immigrants from Hong Kong |
| Minimum | 3.8% | 8.3% |
| Maximum | 78.5% | 100.0% |
| Range | 74.7% | 91.7% |
| Mean | 37.8% | 31.7% |
| Median | 36.7% | 29.4% |
| Interquartile 25% (IQ1) | 31.1% | 23.4% |
| Interquartile 75% (IQ3) | 42.7% | 34.4% |
| Interquartile Range (IQR) | 11.6% | 11.0% |
| Standard Deviation (Sample) | 13.9% | 15.8% |
| Standard Deviation (Population) | 13.7% | 15.7% |
Similar Demographics by In Labor Force | Age 16-19
Demographics Similar to Immigrants from Bahamas by In Labor Force | Age 16-19
In terms of in labor force | age 16-19, the demographic groups most similar to Immigrants from Bahamas are Guatemalan (35.5%, a difference of 0.060%), Turkish (35.4%, a difference of 0.18%), Immigrants from Ghana (35.4%, a difference of 0.19%), Sri Lankan (35.5%, a difference of 0.24%), and Ghanaian (35.3%, a difference of 0.33%).
| Demographics | Rating | Rank | In Labor Force | Age 16-19 |
| Immigrants | Bolivia | 11.0 /100 | #213 | Poor 35.6% |
| Apache | 11.0 /100 | #214 | Poor 35.6% |
| Immigrants | South Eastern Asia | 10.8 /100 | #215 | Poor 35.6% |
| Dutch West Indians | 10.7 /100 | #216 | Poor 35.6% |
| Immigrants | Costa Rica | 10.7 /100 | #217 | Poor 35.6% |
| Sri Lankans | 9.8 /100 | #218 | Tragic 35.5% |
| Guatemalans | 8.6 /100 | #219 | Tragic 35.5% |
| Immigrants | Bahamas | 8.3 /100 | #220 | Tragic 35.5% |
| Turks | 7.3 /100 | #221 | Tragic 35.4% |
| Immigrants | Ghana | 7.3 /100 | #222 | Tragic 35.4% |
| Ghanaians | 6.5 /100 | #223 | Tragic 35.3% |
| Hondurans | 6.5 /100 | #224 | Tragic 35.3% |
| Immigrants | Belgium | 6.1 /100 | #225 | Tragic 35.3% |
| Immigrants | Guatemala | 5.7 /100 | #226 | Tragic 35.3% |
| Mongolians | 5.7 /100 | #227 | Tragic 35.3% |
Demographics Similar to Immigrants from Hong Kong by In Labor Force | Age 16-19
In terms of in labor force | age 16-19, the demographic groups most similar to Immigrants from Hong Kong are Immigrants from Israel (30.5%, a difference of 0.020%), Puerto Rican (30.3%, a difference of 0.42%), Immigrants from Cuba (30.2%, a difference of 0.75%), Immigrants from Trinidad and Tobago (30.2%, a difference of 1.0%), and Immigrants from Bangladesh (30.0%, a difference of 1.4%).
| Demographics | Rating | Rank | In Labor Force | Age 16-19 |
| Immigrants | Dominican Republic | 0.0 /100 | #326 | Tragic 31.1% |
| Immigrants | Taiwan | 0.0 /100 | #327 | Tragic 31.0% |
| Immigrants | Ecuador | 0.0 /100 | #328 | Tragic 31.0% |
| Barbadians | 0.0 /100 | #329 | Tragic 31.0% |
| Lumbee | 0.0 /100 | #330 | Tragic 31.0% |
| Trinidadians and Tobagonians | 0.0 /100 | #331 | Tragic 30.9% |
| Immigrants | Israel | 0.0 /100 | #332 | Tragic 30.5% |
| Immigrants | Hong Kong | 0.0 /100 | #333 | Tragic 30.5% |
| Puerto Ricans | 0.0 /100 | #334 | Tragic 30.3% |
| Immigrants | Cuba | 0.0 /100 | #335 | Tragic 30.2% |
| Immigrants | Trinidad and Tobago | 0.0 /100 | #336 | Tragic 30.2% |
| Immigrants | Bangladesh | 0.0 /100 | #337 | Tragic 30.0% |
| Vietnamese | 0.0 /100 | #338 | Tragic 29.6% |
| Immigrants | Uzbekistan | 0.0 /100 | #339 | Tragic 29.2% |
| British West Indians | 0.0 /100 | #340 | Tragic 29.1% |