Navajo vs Immigrants from Zimbabwe In Labor Force | Age 16-19
COMPARE
Navajo
Immigrants from Zimbabwe
In Labor Force | Age 16-19
In Labor Force | Age 16-19 Comparison
Navajo
Immigrants from Zimbabwe
32.1%
IN LABOR FORCE | AGE 16-19
0.0/ 100
METRIC RATING
308th/ 347
METRIC RANK
38.0%
IN LABOR FORCE | AGE 16-19
95.4/ 100
METRIC RATING
130th/ 347
METRIC RANK
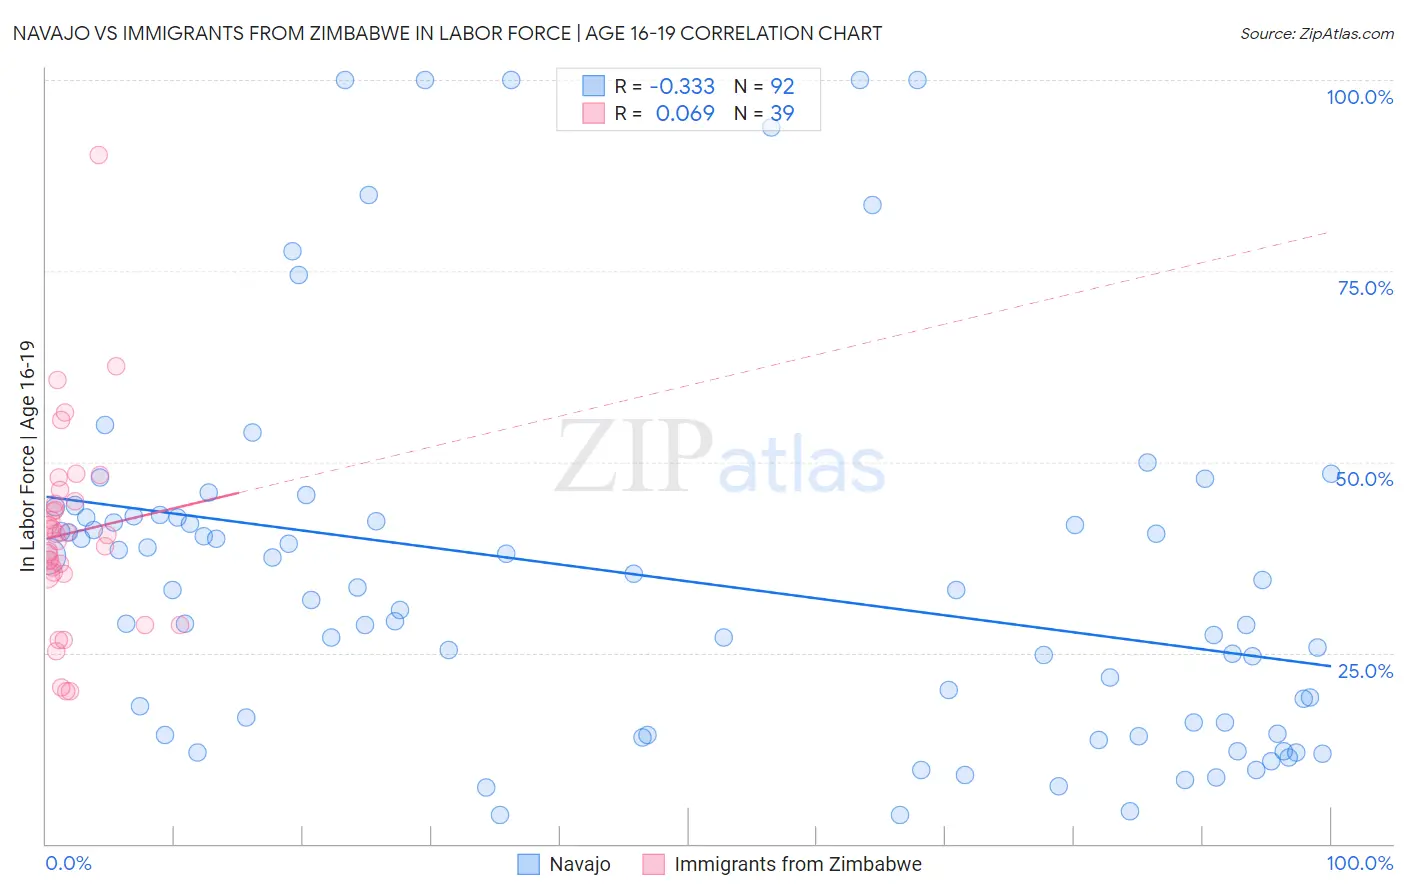
Navajo vs Immigrants from Zimbabwe In Labor Force | Age 16-19 Correlation Chart
The statistical analysis conducted on geographies consisting of 224,572,215 people shows a mild negative correlation between the proportion of Navajo and labor force participation rate among population between the ages 16 and 19 in the United States with a correlation coefficient (R) of -0.333 and weighted average of 32.1%. Similarly, the statistical analysis conducted on geographies consisting of 117,770,176 people shows a slight positive correlation between the proportion of Immigrants from Zimbabwe and labor force participation rate among population between the ages 16 and 19 in the United States with a correlation coefficient (R) of 0.069 and weighted average of 38.0%, a difference of 18.3%.
In Labor Force | Age 16-19 Correlation Summary
| Measurement | Navajo | Immigrants from Zimbabwe |
| Minimum | 3.8% | 20.0% |
| Maximum | 100.0% | 90.2% |
| Range | 96.2% | 70.2% |
| Mean | 35.0% | 40.6% |
| Median | 32.6% | 40.4% |
| Interquartile 25% (IQ1) | 15.1% | 35.3% |
| Interquartile 75% (IQ3) | 42.8% | 44.9% |
| Interquartile Range (IQR) | 27.6% | 9.6% |
| Standard Deviation (Sample) | 24.1% | 13.0% |
| Standard Deviation (Population) | 24.0% | 12.8% |
Similar Demographics by In Labor Force | Age 16-19
Demographics Similar to Navajo by In Labor Force | Age 16-19
In terms of in labor force | age 16-19, the demographic groups most similar to Navajo are Immigrants from Eastern Asia (32.0%, a difference of 0.18%), Immigrants from Iran (32.0%, a difference of 0.32%), Immigrants from Jamaica (32.2%, a difference of 0.35%), Indian (Asian) (31.9%, a difference of 0.68%), and Immigrants from Belize (31.8%, a difference of 0.83%).
| Demographics | Rating | Rank | In Labor Force | Age 16-19 |
| Okinawans | 0.0 /100 | #301 | Tragic 32.8% |
| Belizeans | 0.0 /100 | #302 | Tragic 32.8% |
| Immigrants | Dominica | 0.0 /100 | #303 | Tragic 32.5% |
| Israelis | 0.0 /100 | #304 | Tragic 32.4% |
| Nicaraguans | 0.0 /100 | #305 | Tragic 32.4% |
| Spanish American Indians | 0.0 /100 | #306 | Tragic 32.4% |
| Immigrants | Jamaica | 0.0 /100 | #307 | Tragic 32.2% |
| Navajo | 0.0 /100 | #308 | Tragic 32.1% |
| Immigrants | Eastern Asia | 0.0 /100 | #309 | Tragic 32.0% |
| Immigrants | Iran | 0.0 /100 | #310 | Tragic 32.0% |
| Indians (Asian) | 0.0 /100 | #311 | Tragic 31.9% |
| Immigrants | Belize | 0.0 /100 | #312 | Tragic 31.8% |
| Hopi | 0.0 /100 | #313 | Tragic 31.8% |
| Cubans | 0.0 /100 | #314 | Tragic 31.8% |
| Immigrants | West Indies | 0.0 /100 | #315 | Tragic 31.7% |
Demographics Similar to Immigrants from Zimbabwe by In Labor Force | Age 16-19
In terms of in labor force | age 16-19, the demographic groups most similar to Immigrants from Zimbabwe are Spaniard (38.0%, a difference of 0.030%), New Zealander (38.0%, a difference of 0.050%), African (38.0%, a difference of 0.060%), Choctaw (38.0%, a difference of 0.060%), and Immigrants from Austria (37.9%, a difference of 0.090%).
| Demographics | Rating | Rank | In Labor Force | Age 16-19 |
| Seminole | 96.7 /100 | #123 | Exceptional 38.1% |
| Immigrants | England | 96.4 /100 | #124 | Exceptional 38.1% |
| Immigrants | Africa | 96.1 /100 | #125 | Exceptional 38.0% |
| Africans | 95.6 /100 | #126 | Exceptional 38.0% |
| Choctaw | 95.6 /100 | #127 | Exceptional 38.0% |
| New Zealanders | 95.6 /100 | #128 | Exceptional 38.0% |
| Spaniards | 95.5 /100 | #129 | Exceptional 38.0% |
| Immigrants | Zimbabwe | 95.4 /100 | #130 | Exceptional 38.0% |
| Immigrants | Austria | 95.0 /100 | #131 | Exceptional 37.9% |
| Immigrants | Oceania | 94.7 /100 | #132 | Exceptional 37.9% |
| Cheyenne | 94.6 /100 | #133 | Exceptional 37.9% |
| Immigrants | Netherlands | 93.7 /100 | #134 | Exceptional 37.8% |
| Macedonians | 93.4 /100 | #135 | Exceptional 37.8% |
| Australians | 93.2 /100 | #136 | Exceptional 37.8% |
| Cajuns | 93.2 /100 | #137 | Exceptional 37.8% |