Kiowa vs Immigrants from Hong Kong In Labor Force | Age 16-19
COMPARE
Kiowa
Immigrants from Hong Kong
In Labor Force | Age 16-19
In Labor Force | Age 16-19 Comparison
Kiowa
Immigrants from Hong Kong
37.2%
IN LABOR FORCE | AGE 16-19
80.4/ 100
METRIC RATING
156th/ 347
METRIC RANK
30.5%
IN LABOR FORCE | AGE 16-19
0.0/ 100
METRIC RATING
333rd/ 347
METRIC RANK
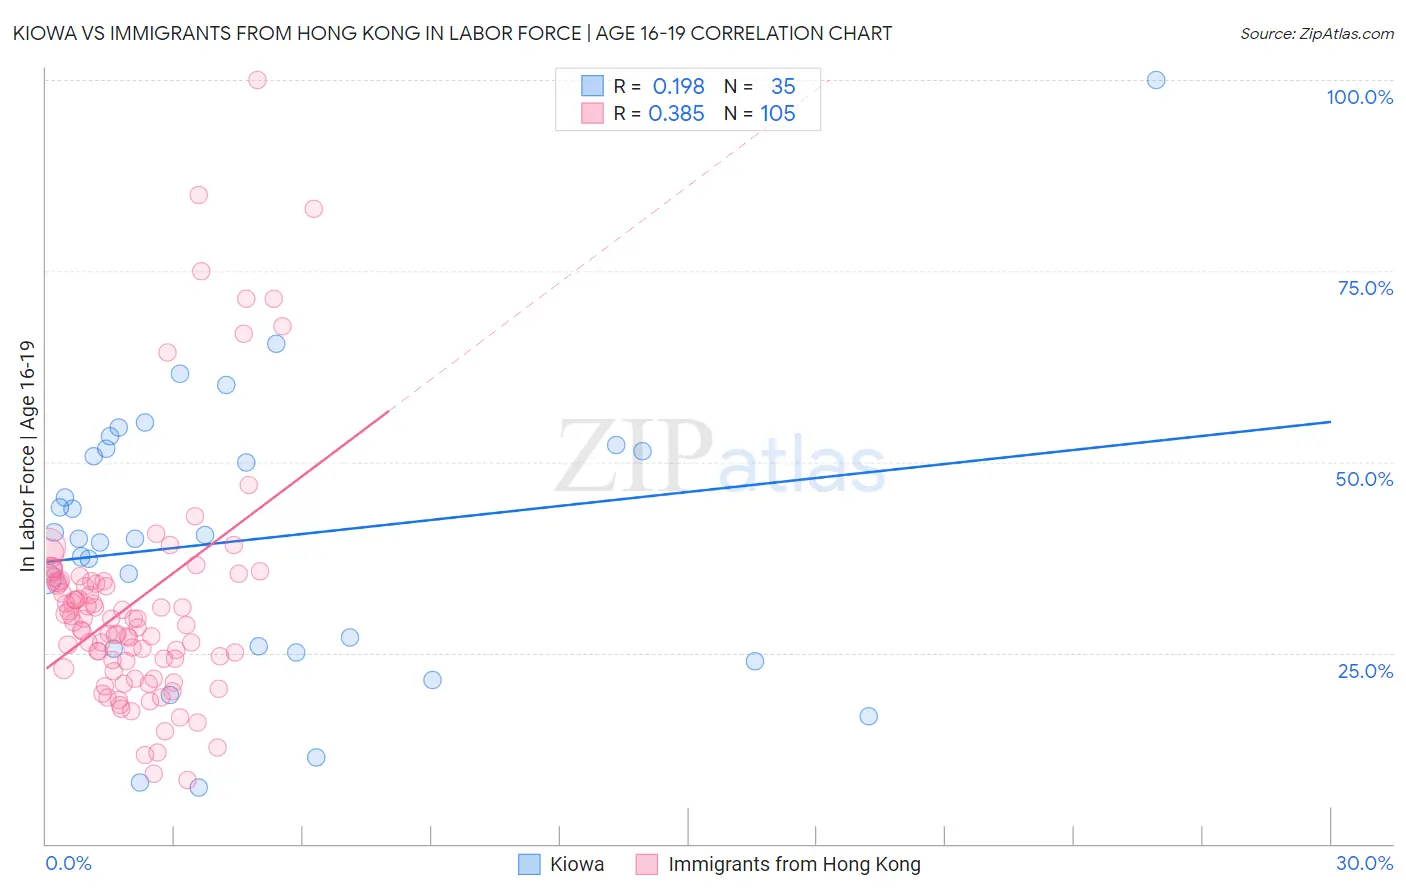
Kiowa vs Immigrants from Hong Kong In Labor Force | Age 16-19 Correlation Chart
The statistical analysis conducted on geographies consisting of 56,077,832 people shows a poor positive correlation between the proportion of Kiowa and labor force participation rate among population between the ages 16 and 19 in the United States with a correlation coefficient (R) of 0.198 and weighted average of 37.2%. Similarly, the statistical analysis conducted on geographies consisting of 253,714,019 people shows a mild positive correlation between the proportion of Immigrants from Hong Kong and labor force participation rate among population between the ages 16 and 19 in the United States with a correlation coefficient (R) of 0.385 and weighted average of 30.5%, a difference of 22.1%.
In Labor Force | Age 16-19 Correlation Summary
| Measurement | Kiowa | Immigrants from Hong Kong |
| Minimum | 7.4% | 8.3% |
| Maximum | 100.0% | 100.0% |
| Range | 92.6% | 91.7% |
| Mean | 39.9% | 31.7% |
| Median | 40.0% | 29.4% |
| Interquartile 25% (IQ1) | 25.5% | 23.4% |
| Interquartile 75% (IQ3) | 51.7% | 34.4% |
| Interquartile Range (IQR) | 26.2% | 11.0% |
| Standard Deviation (Sample) | 18.6% | 15.8% |
| Standard Deviation (Population) | 18.3% | 15.7% |
Similar Demographics by In Labor Force | Age 16-19
Demographics Similar to Kiowa by In Labor Force | Age 16-19
In terms of in labor force | age 16-19, the demographic groups most similar to Kiowa are Immigrants from Lithuania (37.2%, a difference of 0.020%), Immigrants from Bulgaria (37.3%, a difference of 0.10%), Arapaho (37.3%, a difference of 0.12%), Immigrants from Sierra Leone (37.3%, a difference of 0.27%), and Immigrants from Brazil (37.1%, a difference of 0.29%).
| Demographics | Rating | Rank | In Labor Force | Age 16-19 |
| Native Hawaiians | 85.0 /100 | #149 | Excellent 37.4% |
| Tsimshian | 84.7 /100 | #150 | Excellent 37.4% |
| Immigrants | Poland | 84.4 /100 | #151 | Excellent 37.3% |
| Immigrants | Sierra Leone | 83.6 /100 | #152 | Excellent 37.3% |
| Arapaho | 81.8 /100 | #153 | Excellent 37.3% |
| Immigrants | Bulgaria | 81.6 /100 | #154 | Excellent 37.3% |
| Immigrants | Lithuania | 80.7 /100 | #155 | Excellent 37.2% |
| Kiowa | 80.4 /100 | #156 | Excellent 37.2% |
| Immigrants | Brazil | 76.5 /100 | #157 | Good 37.1% |
| Ute | 75.7 /100 | #158 | Good 37.1% |
| Yaqui | 74.4 /100 | #159 | Good 37.1% |
| Immigrants | Saudi Arabia | 73.9 /100 | #160 | Good 37.0% |
| Cambodians | 71.5 /100 | #161 | Good 37.0% |
| Immigrants | Jordan | 69.5 /100 | #162 | Good 36.9% |
| Bermudans | 69.3 /100 | #163 | Good 36.9% |
Demographics Similar to Immigrants from Hong Kong by In Labor Force | Age 16-19
In terms of in labor force | age 16-19, the demographic groups most similar to Immigrants from Hong Kong are Immigrants from Israel (30.5%, a difference of 0.020%), Puerto Rican (30.3%, a difference of 0.42%), Immigrants from Cuba (30.2%, a difference of 0.75%), Immigrants from Trinidad and Tobago (30.2%, a difference of 1.0%), and Immigrants from Bangladesh (30.0%, a difference of 1.4%).
| Demographics | Rating | Rank | In Labor Force | Age 16-19 |
| Immigrants | Dominican Republic | 0.0 /100 | #326 | Tragic 31.1% |
| Immigrants | Taiwan | 0.0 /100 | #327 | Tragic 31.0% |
| Immigrants | Ecuador | 0.0 /100 | #328 | Tragic 31.0% |
| Barbadians | 0.0 /100 | #329 | Tragic 31.0% |
| Lumbee | 0.0 /100 | #330 | Tragic 31.0% |
| Trinidadians and Tobagonians | 0.0 /100 | #331 | Tragic 30.9% |
| Immigrants | Israel | 0.0 /100 | #332 | Tragic 30.5% |
| Immigrants | Hong Kong | 0.0 /100 | #333 | Tragic 30.5% |
| Puerto Ricans | 0.0 /100 | #334 | Tragic 30.3% |
| Immigrants | Cuba | 0.0 /100 | #335 | Tragic 30.2% |
| Immigrants | Trinidad and Tobago | 0.0 /100 | #336 | Tragic 30.2% |
| Immigrants | Bangladesh | 0.0 /100 | #337 | Tragic 30.0% |
| Vietnamese | 0.0 /100 | #338 | Tragic 29.6% |
| Immigrants | Uzbekistan | 0.0 /100 | #339 | Tragic 29.2% |
| British West Indians | 0.0 /100 | #340 | Tragic 29.1% |