Navajo vs Immigrants from Australia In Labor Force | Age 30-34
COMPARE
Navajo
Immigrants from Australia
In Labor Force | Age 30-34
In Labor Force | Age 30-34 Comparison
Navajo
Immigrants from Australia
73.8%
IN LABOR FORCE | AGE 30-34
0.0/ 100
METRIC RATING
347th/ 347
METRIC RANK
85.6%
IN LABOR FORCE | AGE 30-34
99.8/ 100
METRIC RATING
50th/ 347
METRIC RANK
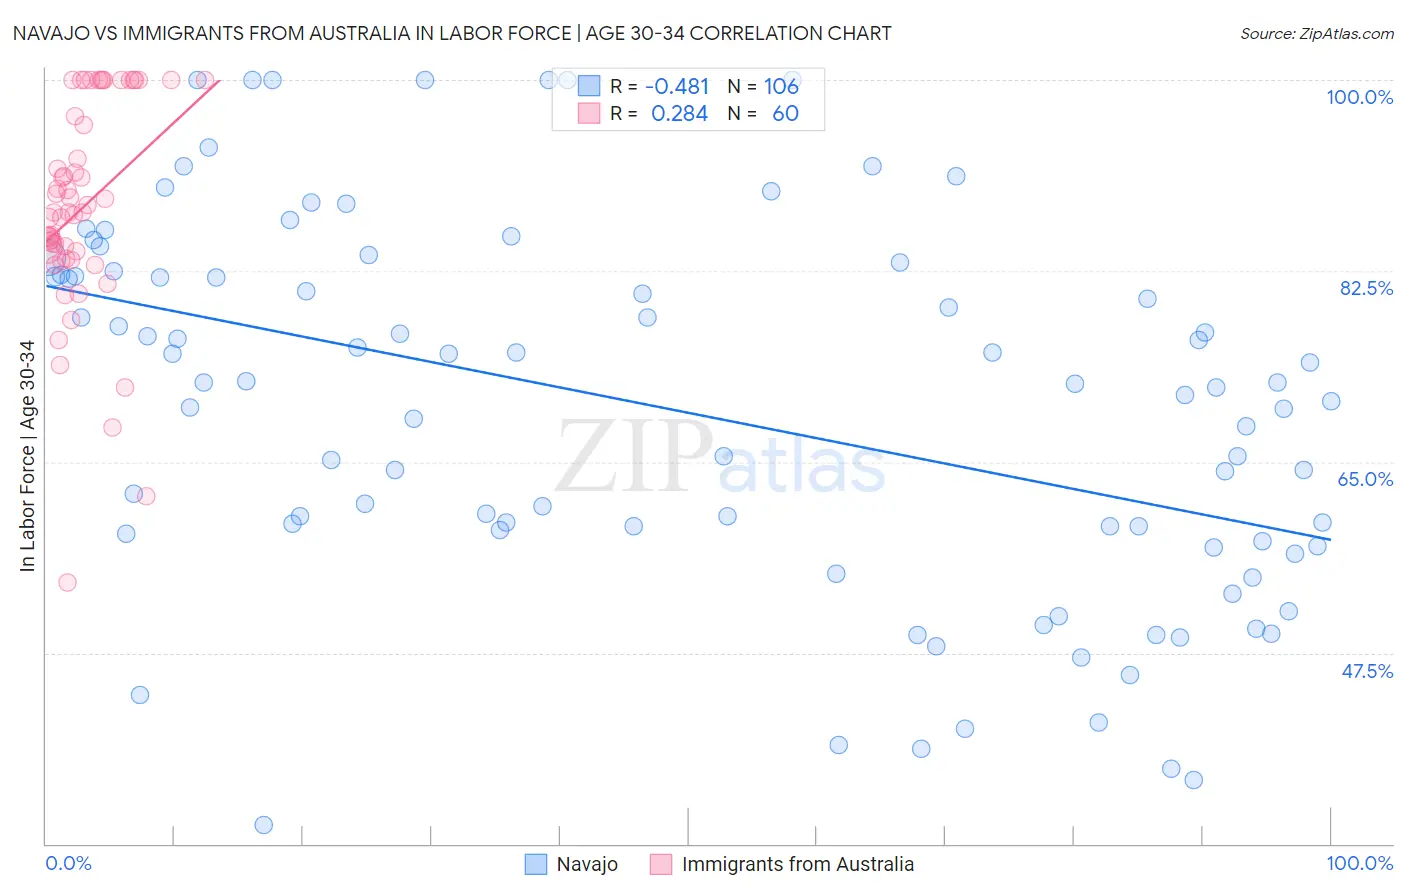
Navajo vs Immigrants from Australia In Labor Force | Age 30-34 Correlation Chart
The statistical analysis conducted on geographies consisting of 224,771,118 people shows a moderate negative correlation between the proportion of Navajo and labor force participation rate among population between the ages 30 and 34 in the United States with a correlation coefficient (R) of -0.481 and weighted average of 73.8%. Similarly, the statistical analysis conducted on geographies consisting of 227,147,173 people shows a weak positive correlation between the proportion of Immigrants from Australia and labor force participation rate among population between the ages 30 and 34 in the United States with a correlation coefficient (R) of 0.284 and weighted average of 85.6%, a difference of 16.0%.
In Labor Force | Age 30-34 Correlation Summary
| Measurement | Navajo | Immigrants from Australia |
| Minimum | 31.7% | 53.9% |
| Maximum | 100.0% | 100.0% |
| Range | 68.3% | 46.1% |
| Mean | 69.8% | 88.3% |
| Median | 72.0% | 87.9% |
| Interquartile 25% (IQ1) | 58.5% | 84.0% |
| Interquartile 75% (IQ3) | 82.0% | 98.4% |
| Interquartile Range (IQR) | 23.6% | 14.4% |
| Standard Deviation (Sample) | 16.9% | 9.8% |
| Standard Deviation (Population) | 16.8% | 9.7% |
Similar Demographics by In Labor Force | Age 30-34
Demographics Similar to Navajo by In Labor Force | Age 30-34
In terms of in labor force | age 30-34, the demographic groups most similar to Navajo are Crow (75.9%, a difference of 2.9%), Yup'ik (76.4%, a difference of 3.6%), Yuman (77.1%, a difference of 4.5%), Lumbee (77.3%, a difference of 4.8%), and Tohono O'odham (77.7%, a difference of 5.4%).
| Demographics | Rating | Rank | In Labor Force | Age 30-34 |
| Inupiat | 0.0 /100 | #333 | Tragic 79.7% |
| Hopi | 0.0 /100 | #334 | Tragic 79.3% |
| Marshallese | 0.0 /100 | #335 | Tragic 79.2% |
| Natives/Alaskans | 0.0 /100 | #336 | Tragic 79.2% |
| Yakama | 0.0 /100 | #337 | Tragic 79.1% |
| Pima | 0.0 /100 | #338 | Tragic 79.0% |
| Apache | 0.0 /100 | #339 | Tragic 79.0% |
| Ute | 0.0 /100 | #340 | Tragic 78.9% |
| Immigrants | Yemen | 0.0 /100 | #341 | Tragic 78.2% |
| Tohono O'odham | 0.0 /100 | #342 | Tragic 77.7% |
| Lumbee | 0.0 /100 | #343 | Tragic 77.3% |
| Yuman | 0.0 /100 | #344 | Tragic 77.1% |
| Yup'ik | 0.0 /100 | #345 | Tragic 76.4% |
| Crow | 0.0 /100 | #346 | Tragic 75.9% |
| Navajo | 0.0 /100 | #347 | Tragic 73.8% |
Demographics Similar to Immigrants from Australia by In Labor Force | Age 30-34
In terms of in labor force | age 30-34, the demographic groups most similar to Immigrants from Australia are Immigrants from Sweden (85.6%, a difference of 0.010%), Lithuanian (85.6%, a difference of 0.010%), Cape Verdean (85.6%, a difference of 0.020%), Immigrants from Morocco (85.6%, a difference of 0.030%), and Croatian (85.6%, a difference of 0.030%).
| Demographics | Rating | Rank | In Labor Force | Age 30-34 |
| Immigrants | Lithuania | 99.8 /100 | #43 | Exceptional 85.6% |
| Immigrants | Sri Lanka | 99.8 /100 | #44 | Exceptional 85.6% |
| Immigrants | Nepal | 99.8 /100 | #45 | Exceptional 85.6% |
| Immigrants | Morocco | 99.8 /100 | #46 | Exceptional 85.6% |
| Croatians | 99.8 /100 | #47 | Exceptional 85.6% |
| Immigrants | Sweden | 99.8 /100 | #48 | Exceptional 85.6% |
| Lithuanians | 99.8 /100 | #49 | Exceptional 85.6% |
| Immigrants | Australia | 99.8 /100 | #50 | Exceptional 85.6% |
| Cape Verdeans | 99.7 /100 | #51 | Exceptional 85.6% |
| Slovenes | 99.7 /100 | #52 | Exceptional 85.6% |
| Filipinos | 99.6 /100 | #53 | Exceptional 85.5% |
| Immigrants | Kenya | 99.6 /100 | #54 | Exceptional 85.5% |
| Immigrants | Turkey | 99.6 /100 | #55 | Exceptional 85.5% |
| Czechs | 99.6 /100 | #56 | Exceptional 85.5% |
| Russians | 99.6 /100 | #57 | Exceptional 85.5% |