Navajo vs Immigrants from Burma/Myanmar In Labor Force | Age 30-34
COMPARE
Navajo
Immigrants from Burma/Myanmar
In Labor Force | Age 30-34
In Labor Force | Age 30-34 Comparison
Navajo
Immigrants from Burma/Myanmar
73.8%
IN LABOR FORCE | AGE 30-34
0.0/ 100
METRIC RATING
347th/ 347
METRIC RANK
84.7%
IN LABOR FORCE | AGE 30-34
52.0/ 100
METRIC RATING
170th/ 347
METRIC RANK
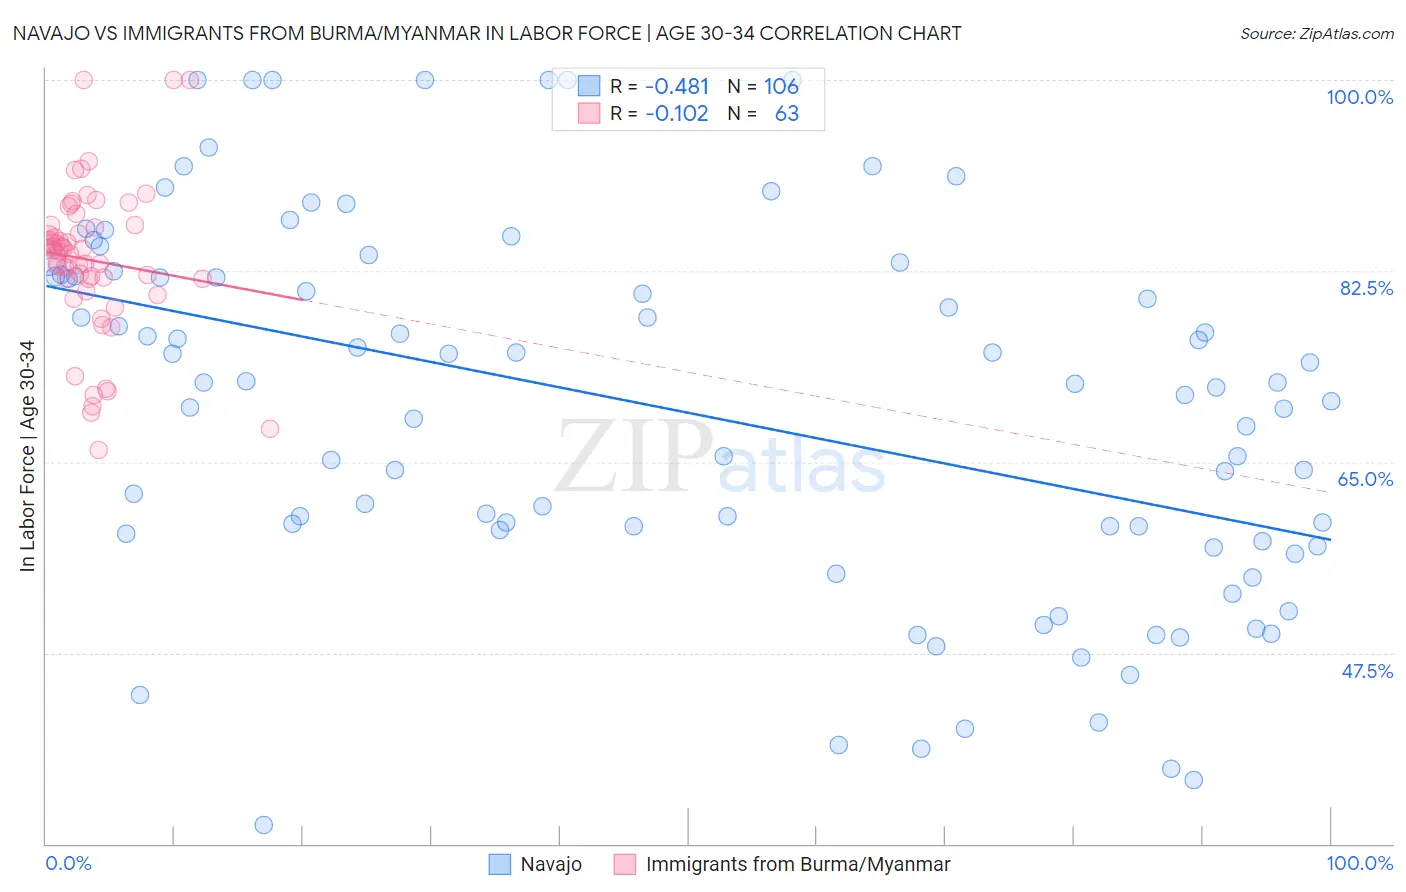
Navajo vs Immigrants from Burma/Myanmar In Labor Force | Age 30-34 Correlation Chart
The statistical analysis conducted on geographies consisting of 224,771,118 people shows a moderate negative correlation between the proportion of Navajo and labor force participation rate among population between the ages 30 and 34 in the United States with a correlation coefficient (R) of -0.481 and weighted average of 73.8%. Similarly, the statistical analysis conducted on geographies consisting of 172,303,659 people shows a poor negative correlation between the proportion of Immigrants from Burma/Myanmar and labor force participation rate among population between the ages 30 and 34 in the United States with a correlation coefficient (R) of -0.102 and weighted average of 84.7%, a difference of 14.8%.
In Labor Force | Age 30-34 Correlation Summary
| Measurement | Navajo | Immigrants from Burma/Myanmar |
| Minimum | 31.7% | 66.1% |
| Maximum | 100.0% | 100.0% |
| Range | 68.3% | 33.9% |
| Mean | 69.8% | 83.5% |
| Median | 72.0% | 84.4% |
| Interquartile 25% (IQ1) | 58.5% | 81.8% |
| Interquartile 75% (IQ3) | 82.0% | 86.7% |
| Interquartile Range (IQR) | 23.6% | 4.9% |
| Standard Deviation (Sample) | 16.9% | 6.9% |
| Standard Deviation (Population) | 16.8% | 6.9% |
Similar Demographics by In Labor Force | Age 30-34
Demographics Similar to Navajo by In Labor Force | Age 30-34
In terms of in labor force | age 30-34, the demographic groups most similar to Navajo are Crow (75.9%, a difference of 2.9%), Yup'ik (76.4%, a difference of 3.6%), Yuman (77.1%, a difference of 4.5%), Lumbee (77.3%, a difference of 4.8%), and Tohono O'odham (77.7%, a difference of 5.4%).
| Demographics | Rating | Rank | In Labor Force | Age 30-34 |
| Inupiat | 0.0 /100 | #333 | Tragic 79.7% |
| Hopi | 0.0 /100 | #334 | Tragic 79.3% |
| Marshallese | 0.0 /100 | #335 | Tragic 79.2% |
| Natives/Alaskans | 0.0 /100 | #336 | Tragic 79.2% |
| Yakama | 0.0 /100 | #337 | Tragic 79.1% |
| Pima | 0.0 /100 | #338 | Tragic 79.0% |
| Apache | 0.0 /100 | #339 | Tragic 79.0% |
| Ute | 0.0 /100 | #340 | Tragic 78.9% |
| Immigrants | Yemen | 0.0 /100 | #341 | Tragic 78.2% |
| Tohono O'odham | 0.0 /100 | #342 | Tragic 77.7% |
| Lumbee | 0.0 /100 | #343 | Tragic 77.3% |
| Yuman | 0.0 /100 | #344 | Tragic 77.1% |
| Yup'ik | 0.0 /100 | #345 | Tragic 76.4% |
| Crow | 0.0 /100 | #346 | Tragic 75.9% |
| Navajo | 0.0 /100 | #347 | Tragic 73.8% |
Demographics Similar to Immigrants from Burma/Myanmar by In Labor Force | Age 30-34
In terms of in labor force | age 30-34, the demographic groups most similar to Immigrants from Burma/Myanmar are Immigrants from Peru (84.7%, a difference of 0.0%), South American Indian (84.7%, a difference of 0.0%), Irish (84.7%, a difference of 0.0%), Immigrants from England (84.7%, a difference of 0.0%), and Israeli (84.7%, a difference of 0.010%).
| Demographics | Rating | Rank | In Labor Force | Age 30-34 |
| Immigrants | Uruguay | 57.4 /100 | #163 | Average 84.7% |
| Icelanders | 56.8 /100 | #164 | Average 84.7% |
| Immigrants | Western Europe | 56.7 /100 | #165 | Average 84.7% |
| Afghans | 55.2 /100 | #166 | Average 84.7% |
| Immigrants | South Eastern Asia | 54.2 /100 | #167 | Average 84.7% |
| Immigrants | Peru | 52.4 /100 | #168 | Average 84.7% |
| South American Indians | 52.1 /100 | #169 | Average 84.7% |
| Immigrants | Burma/Myanmar | 52.0 /100 | #170 | Average 84.7% |
| Irish | 52.0 /100 | #171 | Average 84.7% |
| Immigrants | England | 51.7 /100 | #172 | Average 84.7% |
| Israelis | 51.1 /100 | #173 | Average 84.7% |
| Finns | 50.0 /100 | #174 | Average 84.7% |
| Immigrants | South America | 50.0 /100 | #175 | Average 84.7% |
| Immigrants | Uzbekistan | 49.1 /100 | #176 | Average 84.7% |
| Laotians | 46.9 /100 | #177 | Average 84.7% |