Navajo vs Cypriot In Labor Force | Age 30-34
COMPARE
Navajo
Cypriot
In Labor Force | Age 30-34
In Labor Force | Age 30-34 Comparison
Navajo
Cypriots
73.8%
IN LABOR FORCE | AGE 30-34
0.0/ 100
METRIC RATING
347th/ 347
METRIC RANK
85.8%
IN LABOR FORCE | AGE 30-34
99.9/ 100
METRIC RATING
32nd/ 347
METRIC RANK
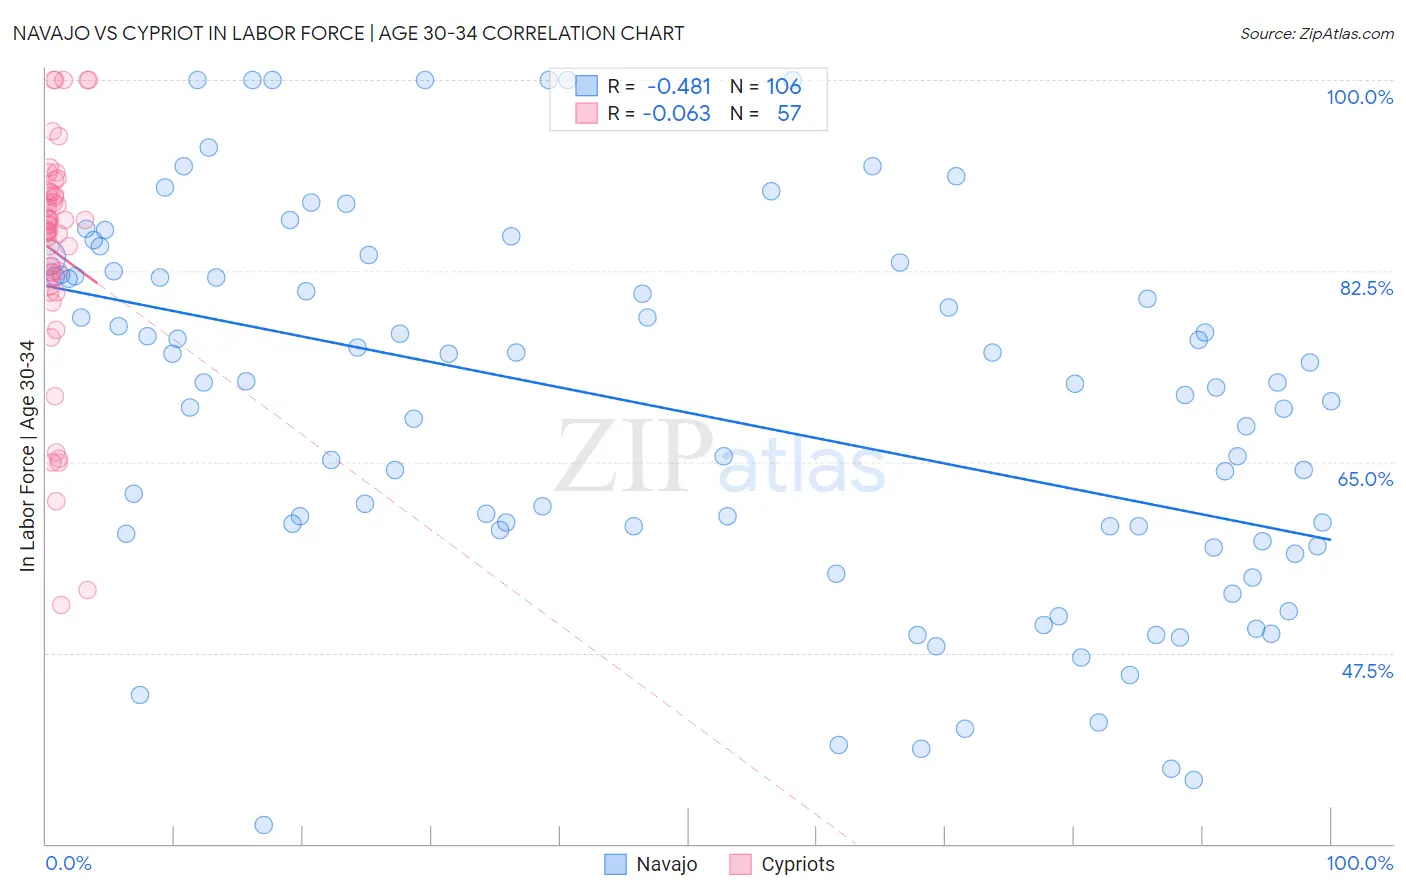
Navajo vs Cypriot In Labor Force | Age 30-34 Correlation Chart
The statistical analysis conducted on geographies consisting of 224,771,118 people shows a moderate negative correlation between the proportion of Navajo and labor force participation rate among population between the ages 30 and 34 in the United States with a correlation coefficient (R) of -0.481 and weighted average of 73.8%. Similarly, the statistical analysis conducted on geographies consisting of 61,842,165 people shows a slight negative correlation between the proportion of Cypriots and labor force participation rate among population between the ages 30 and 34 in the United States with a correlation coefficient (R) of -0.063 and weighted average of 85.8%, a difference of 16.3%.
In Labor Force | Age 30-34 Correlation Summary
| Measurement | Navajo | Cypriot |
| Minimum | 31.7% | 51.9% |
| Maximum | 100.0% | 100.0% |
| Range | 68.3% | 48.1% |
| Mean | 69.8% | 84.2% |
| Median | 72.0% | 86.7% |
| Interquartile 25% (IQ1) | 58.5% | 81.4% |
| Interquartile 75% (IQ3) | 82.0% | 89.6% |
| Interquartile Range (IQR) | 23.6% | 8.1% |
| Standard Deviation (Sample) | 16.9% | 10.7% |
| Standard Deviation (Population) | 16.8% | 10.6% |
Similar Demographics by In Labor Force | Age 30-34
Demographics Similar to Navajo by In Labor Force | Age 30-34
In terms of in labor force | age 30-34, the demographic groups most similar to Navajo are Crow (75.9%, a difference of 2.9%), Yup'ik (76.4%, a difference of 3.6%), Yuman (77.1%, a difference of 4.5%), Lumbee (77.3%, a difference of 4.8%), and Tohono O'odham (77.7%, a difference of 5.4%).
| Demographics | Rating | Rank | In Labor Force | Age 30-34 |
| Inupiat | 0.0 /100 | #333 | Tragic 79.7% |
| Hopi | 0.0 /100 | #334 | Tragic 79.3% |
| Marshallese | 0.0 /100 | #335 | Tragic 79.2% |
| Natives/Alaskans | 0.0 /100 | #336 | Tragic 79.2% |
| Yakama | 0.0 /100 | #337 | Tragic 79.1% |
| Pima | 0.0 /100 | #338 | Tragic 79.0% |
| Apache | 0.0 /100 | #339 | Tragic 79.0% |
| Ute | 0.0 /100 | #340 | Tragic 78.9% |
| Immigrants | Yemen | 0.0 /100 | #341 | Tragic 78.2% |
| Tohono O'odham | 0.0 /100 | #342 | Tragic 77.7% |
| Lumbee | 0.0 /100 | #343 | Tragic 77.3% |
| Yuman | 0.0 /100 | #344 | Tragic 77.1% |
| Yup'ik | 0.0 /100 | #345 | Tragic 76.4% |
| Crow | 0.0 /100 | #346 | Tragic 75.9% |
| Navajo | 0.0 /100 | #347 | Tragic 73.8% |
Demographics Similar to Cypriots by In Labor Force | Age 30-34
In terms of in labor force | age 30-34, the demographic groups most similar to Cypriots are Paraguayan (85.8%, a difference of 0.0%), Immigrants from Hong Kong (85.8%, a difference of 0.020%), Immigrants from Bosnia and Herzegovina (85.8%, a difference of 0.040%), Ugandan (85.8%, a difference of 0.050%), and Serbian (85.8%, a difference of 0.050%).
| Demographics | Rating | Rank | In Labor Force | Age 30-34 |
| Immigrants | North Macedonia | 100.0 /100 | #25 | Exceptional 85.9% |
| Immigrants | Eastern Africa | 100.0 /100 | #26 | Exceptional 85.9% |
| Immigrants | Liberia | 100.0 /100 | #27 | Exceptional 85.9% |
| Immigrants | Latvia | 100.0 /100 | #28 | Exceptional 85.9% |
| Tsimshian | 100.0 /100 | #29 | Exceptional 85.8% |
| Immigrants | Hong Kong | 100.0 /100 | #30 | Exceptional 85.8% |
| Paraguayans | 99.9 /100 | #31 | Exceptional 85.8% |
| Cypriots | 99.9 /100 | #32 | Exceptional 85.8% |
| Immigrants | Bosnia and Herzegovina | 99.9 /100 | #33 | Exceptional 85.8% |
| Ugandans | 99.9 /100 | #34 | Exceptional 85.8% |
| Serbians | 99.9 /100 | #35 | Exceptional 85.8% |
| Albanians | 99.9 /100 | #36 | Exceptional 85.7% |
| Norwegians | 99.9 /100 | #37 | Exceptional 85.7% |
| Immigrants | Greece | 99.9 /100 | #38 | Exceptional 85.7% |
| Eastern Europeans | 99.9 /100 | #39 | Exceptional 85.7% |