Pennsylvania German vs Immigrants from Australia In Labor Force | Age 30-34
COMPARE
Pennsylvania German
Immigrants from Australia
In Labor Force | Age 30-34
In Labor Force | Age 30-34 Comparison
Pennsylvania Germans
Immigrants from Australia
82.6%
IN LABOR FORCE | AGE 30-34
0.0/ 100
METRIC RATING
295th/ 347
METRIC RANK
85.6%
IN LABOR FORCE | AGE 30-34
99.8/ 100
METRIC RATING
50th/ 347
METRIC RANK
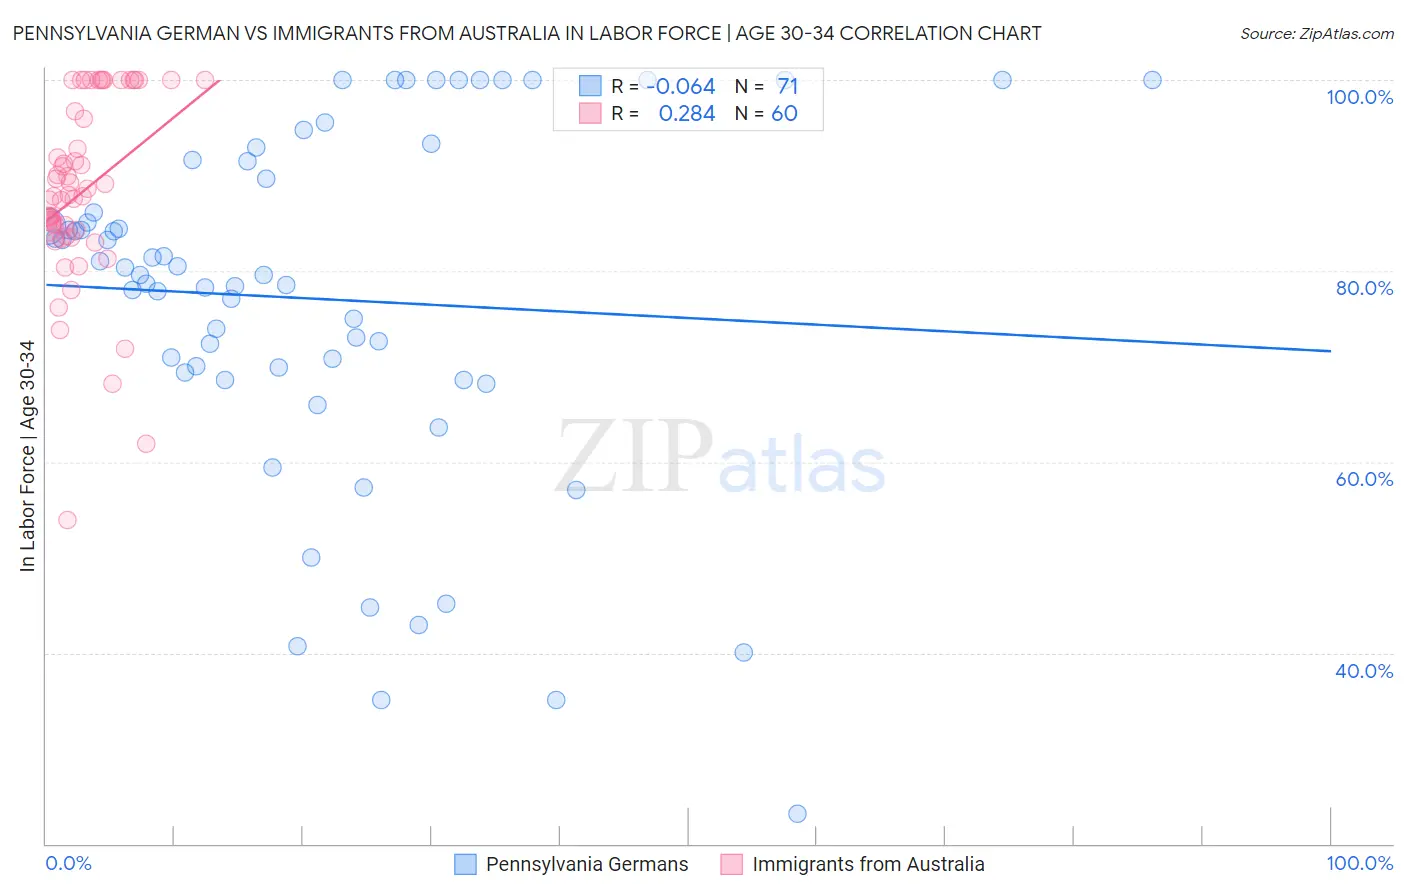
Pennsylvania German vs Immigrants from Australia In Labor Force | Age 30-34 Correlation Chart
The statistical analysis conducted on geographies consisting of 233,986,742 people shows a slight negative correlation between the proportion of Pennsylvania Germans and labor force participation rate among population between the ages 30 and 34 in the United States with a correlation coefficient (R) of -0.064 and weighted average of 82.6%. Similarly, the statistical analysis conducted on geographies consisting of 227,147,173 people shows a weak positive correlation between the proportion of Immigrants from Australia and labor force participation rate among population between the ages 30 and 34 in the United States with a correlation coefficient (R) of 0.284 and weighted average of 85.6%, a difference of 3.6%.
In Labor Force | Age 30-34 Correlation Summary
| Measurement | Pennsylvania German | Immigrants from Australia |
| Minimum | 23.2% | 53.9% |
| Maximum | 100.0% | 100.0% |
| Range | 76.8% | 46.1% |
| Mean | 77.1% | 88.3% |
| Median | 79.6% | 87.9% |
| Interquartile 25% (IQ1) | 69.4% | 84.0% |
| Interquartile 75% (IQ3) | 91.4% | 98.4% |
| Interquartile Range (IQR) | 22.0% | 14.4% |
| Standard Deviation (Sample) | 18.4% | 9.8% |
| Standard Deviation (Population) | 18.3% | 9.7% |
Similar Demographics by In Labor Force | Age 30-34
Demographics Similar to Pennsylvania Germans by In Labor Force | Age 30-34
In terms of in labor force | age 30-34, the demographic groups most similar to Pennsylvania Germans are Chippewa (82.6%, a difference of 0.020%), Comanche (82.6%, a difference of 0.030%), Aleut (82.6%, a difference of 0.030%), American (82.7%, a difference of 0.12%), and Nepalese (82.7%, a difference of 0.14%).
| Demographics | Rating | Rank | In Labor Force | Age 30-34 |
| Central American Indians | 0.0 /100 | #288 | Tragic 83.0% |
| Hawaiians | 0.0 /100 | #289 | Tragic 83.0% |
| Blackfeet | 0.0 /100 | #290 | Tragic 82.8% |
| Potawatomi | 0.0 /100 | #291 | Tragic 82.8% |
| Blacks/African Americans | 0.0 /100 | #292 | Tragic 82.8% |
| Nepalese | 0.0 /100 | #293 | Tragic 82.7% |
| Americans | 0.0 /100 | #294 | Tragic 82.7% |
| Pennsylvania Germans | 0.0 /100 | #295 | Tragic 82.6% |
| Chippewa | 0.0 /100 | #296 | Tragic 82.6% |
| Comanche | 0.0 /100 | #297 | Tragic 82.6% |
| Aleuts | 0.0 /100 | #298 | Tragic 82.6% |
| Immigrants | Central America | 0.0 /100 | #299 | Tragic 82.5% |
| Hmong | 0.0 /100 | #300 | Tragic 82.4% |
| Hispanics or Latinos | 0.0 /100 | #301 | Tragic 82.4% |
| Ottawa | 0.0 /100 | #302 | Tragic 82.4% |
Demographics Similar to Immigrants from Australia by In Labor Force | Age 30-34
In terms of in labor force | age 30-34, the demographic groups most similar to Immigrants from Australia are Immigrants from Sweden (85.6%, a difference of 0.010%), Lithuanian (85.6%, a difference of 0.010%), Cape Verdean (85.6%, a difference of 0.020%), Immigrants from Morocco (85.6%, a difference of 0.030%), and Croatian (85.6%, a difference of 0.030%).
| Demographics | Rating | Rank | In Labor Force | Age 30-34 |
| Immigrants | Lithuania | 99.8 /100 | #43 | Exceptional 85.6% |
| Immigrants | Sri Lanka | 99.8 /100 | #44 | Exceptional 85.6% |
| Immigrants | Nepal | 99.8 /100 | #45 | Exceptional 85.6% |
| Immigrants | Morocco | 99.8 /100 | #46 | Exceptional 85.6% |
| Croatians | 99.8 /100 | #47 | Exceptional 85.6% |
| Immigrants | Sweden | 99.8 /100 | #48 | Exceptional 85.6% |
| Lithuanians | 99.8 /100 | #49 | Exceptional 85.6% |
| Immigrants | Australia | 99.8 /100 | #50 | Exceptional 85.6% |
| Cape Verdeans | 99.7 /100 | #51 | Exceptional 85.6% |
| Slovenes | 99.7 /100 | #52 | Exceptional 85.6% |
| Filipinos | 99.6 /100 | #53 | Exceptional 85.5% |
| Immigrants | Kenya | 99.6 /100 | #54 | Exceptional 85.5% |
| Immigrants | Turkey | 99.6 /100 | #55 | Exceptional 85.5% |
| Czechs | 99.6 /100 | #56 | Exceptional 85.5% |
| Russians | 99.6 /100 | #57 | Exceptional 85.5% |