Navajo vs Immigrants from Australia Single Father Households
COMPARE
Navajo
Immigrants from Australia
Single Father Households
Single Father Households Comparison
Navajo
Immigrants from Australia
3.2%
SINGLE FATHER HOUSEHOLDS
0.0/ 100
METRIC RATING
331st/ 347
METRIC RANK
2.0%
SINGLE FATHER HOUSEHOLDS
100.0/ 100
METRIC RATING
34th/ 347
METRIC RANK
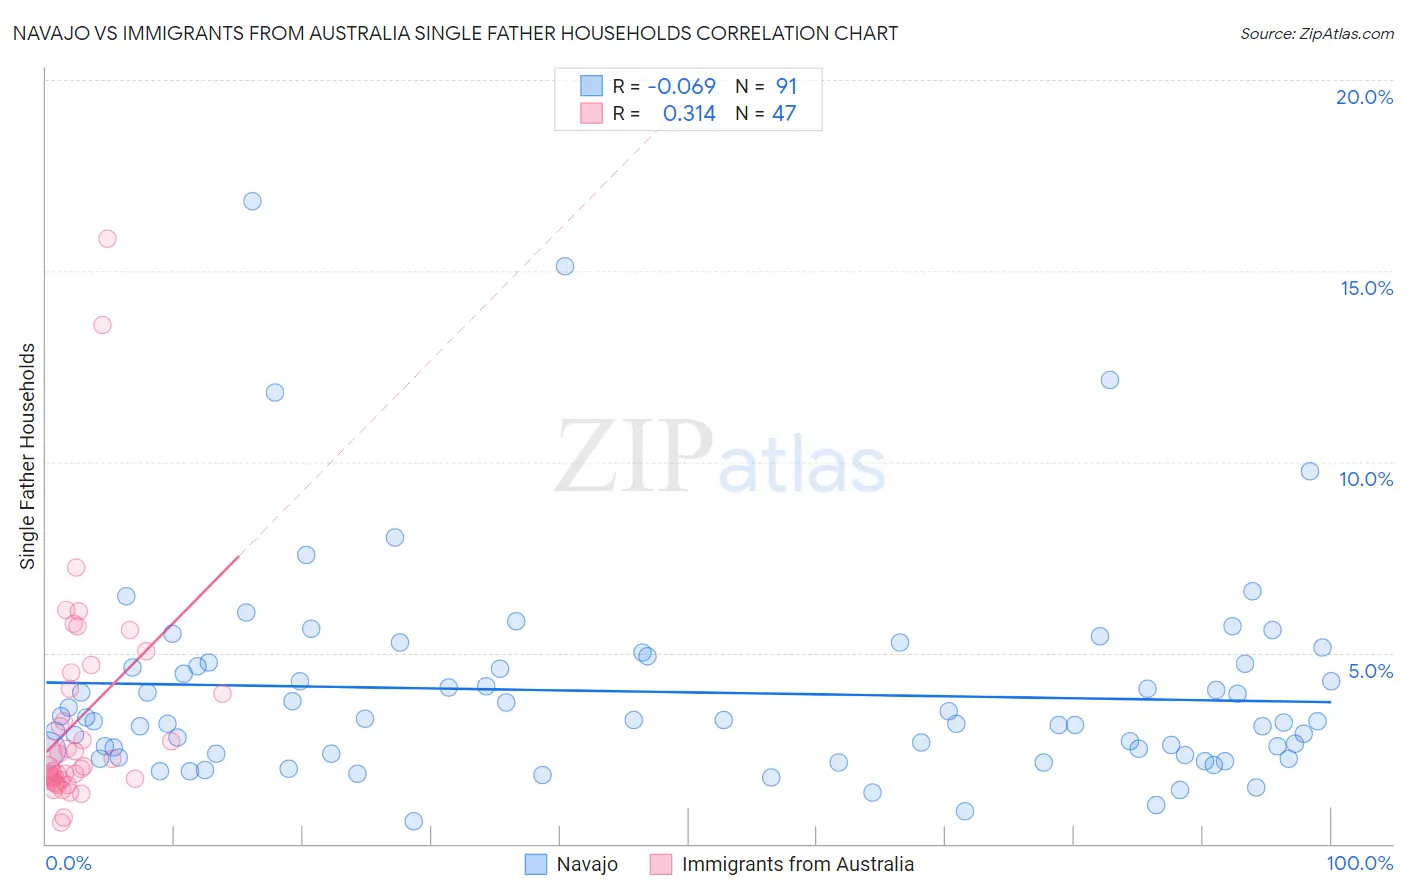
Navajo vs Immigrants from Australia Single Father Households Correlation Chart
The statistical analysis conducted on geographies consisting of 223,786,541 people shows a slight negative correlation between the proportion of Navajo and percentage of single father households in the United States with a correlation coefficient (R) of -0.069 and weighted average of 3.2%. Similarly, the statistical analysis conducted on geographies consisting of 225,821,838 people shows a mild positive correlation between the proportion of Immigrants from Australia and percentage of single father households in the United States with a correlation coefficient (R) of 0.314 and weighted average of 2.0%, a difference of 61.3%.
Single Father Households Correlation Summary
| Measurement | Navajo | Immigrants from Australia |
| Minimum | 0.57% | 0.57% |
| Maximum | 16.8% | 15.8% |
| Range | 16.2% | 15.3% |
| Mean | 4.0% | 3.2% |
| Median | 3.2% | 2.0% |
| Interquartile 25% (IQ1) | 2.4% | 1.7% |
| Interquartile 75% (IQ3) | 4.7% | 4.1% |
| Interquartile Range (IQR) | 2.4% | 2.4% |
| Standard Deviation (Sample) | 2.7% | 2.9% |
| Standard Deviation (Population) | 2.7% | 2.9% |
Similar Demographics by Single Father Households
Demographics Similar to Navajo by Single Father Households
In terms of single father households, the demographic groups most similar to Navajo are Yaqui (3.2%, a difference of 0.040%), Native/Alaskan (3.2%, a difference of 0.54%), Nepalese (3.1%, a difference of 2.3%), Chippewa (3.1%, a difference of 3.2%), and Immigrants from Cabo Verde (3.1%, a difference of 3.3%).
| Demographics | Rating | Rank | Single Father Households |
| Fijians | 0.0 /100 | #324 | Tragic 3.0% |
| Immigrants | Mexico | 0.0 /100 | #325 | Tragic 3.0% |
| Aleuts | 0.0 /100 | #326 | Tragic 3.0% |
| Bangladeshis | 0.0 /100 | #327 | Tragic 3.1% |
| Immigrants | Cabo Verde | 0.0 /100 | #328 | Tragic 3.1% |
| Chippewa | 0.0 /100 | #329 | Tragic 3.1% |
| Nepalese | 0.0 /100 | #330 | Tragic 3.1% |
| Navajo | 0.0 /100 | #331 | Tragic 3.2% |
| Yaqui | 0.0 /100 | #332 | Tragic 3.2% |
| Natives/Alaskans | 0.0 /100 | #333 | Tragic 3.2% |
| Yuman | 0.0 /100 | #334 | Tragic 3.3% |
| Colville | 0.0 /100 | #335 | Tragic 3.3% |
| Paiute | 0.0 /100 | #336 | Tragic 3.3% |
| Pueblo | 0.0 /100 | #337 | Tragic 3.3% |
| Sioux | 0.0 /100 | #338 | Tragic 3.3% |
Demographics Similar to Immigrants from Australia by Single Father Households
In terms of single father households, the demographic groups most similar to Immigrants from Australia are Turkish (2.0%, a difference of 0.020%), Chinese (2.0%, a difference of 0.23%), Israeli (2.0%, a difference of 0.28%), Cambodian (2.0%, a difference of 0.31%), and Albanian (2.0%, a difference of 0.32%).
| Demographics | Rating | Rank | Single Father Households |
| Immigrants | South Central Asia | 100.0 /100 | #27 | Exceptional 2.0% |
| Immigrants | Japan | 100.0 /100 | #28 | Exceptional 2.0% |
| Bulgarians | 100.0 /100 | #29 | Exceptional 2.0% |
| Cambodians | 100.0 /100 | #30 | Exceptional 2.0% |
| Israelis | 100.0 /100 | #31 | Exceptional 2.0% |
| Chinese | 100.0 /100 | #32 | Exceptional 2.0% |
| Turks | 100.0 /100 | #33 | Exceptional 2.0% |
| Immigrants | Australia | 100.0 /100 | #34 | Exceptional 2.0% |
| Albanians | 100.0 /100 | #35 | Exceptional 2.0% |
| Immigrants | Belgium | 100.0 /100 | #36 | Exceptional 2.0% |
| Immigrants | St. Vincent and the Grenadines | 100.0 /100 | #37 | Exceptional 2.0% |
| Immigrants | Eastern Europe | 100.0 /100 | #38 | Exceptional 2.0% |
| Immigrants | Sri Lanka | 100.0 /100 | #39 | Exceptional 2.0% |
| Immigrants | Bulgaria | 100.0 /100 | #40 | Exceptional 2.0% |
| Immigrants | Turkey | 100.0 /100 | #41 | Exceptional 2.0% |