Dutch vs Immigrants from Australia In Labor Force | Age 30-34
COMPARE
Dutch
Immigrants from Australia
In Labor Force | Age 30-34
In Labor Force | Age 30-34 Comparison
Dutch
Immigrants from Australia
84.5%
IN LABOR FORCE | AGE 30-34
20.2/ 100
METRIC RATING
198th/ 347
METRIC RANK
85.6%
IN LABOR FORCE | AGE 30-34
99.8/ 100
METRIC RATING
50th/ 347
METRIC RANK
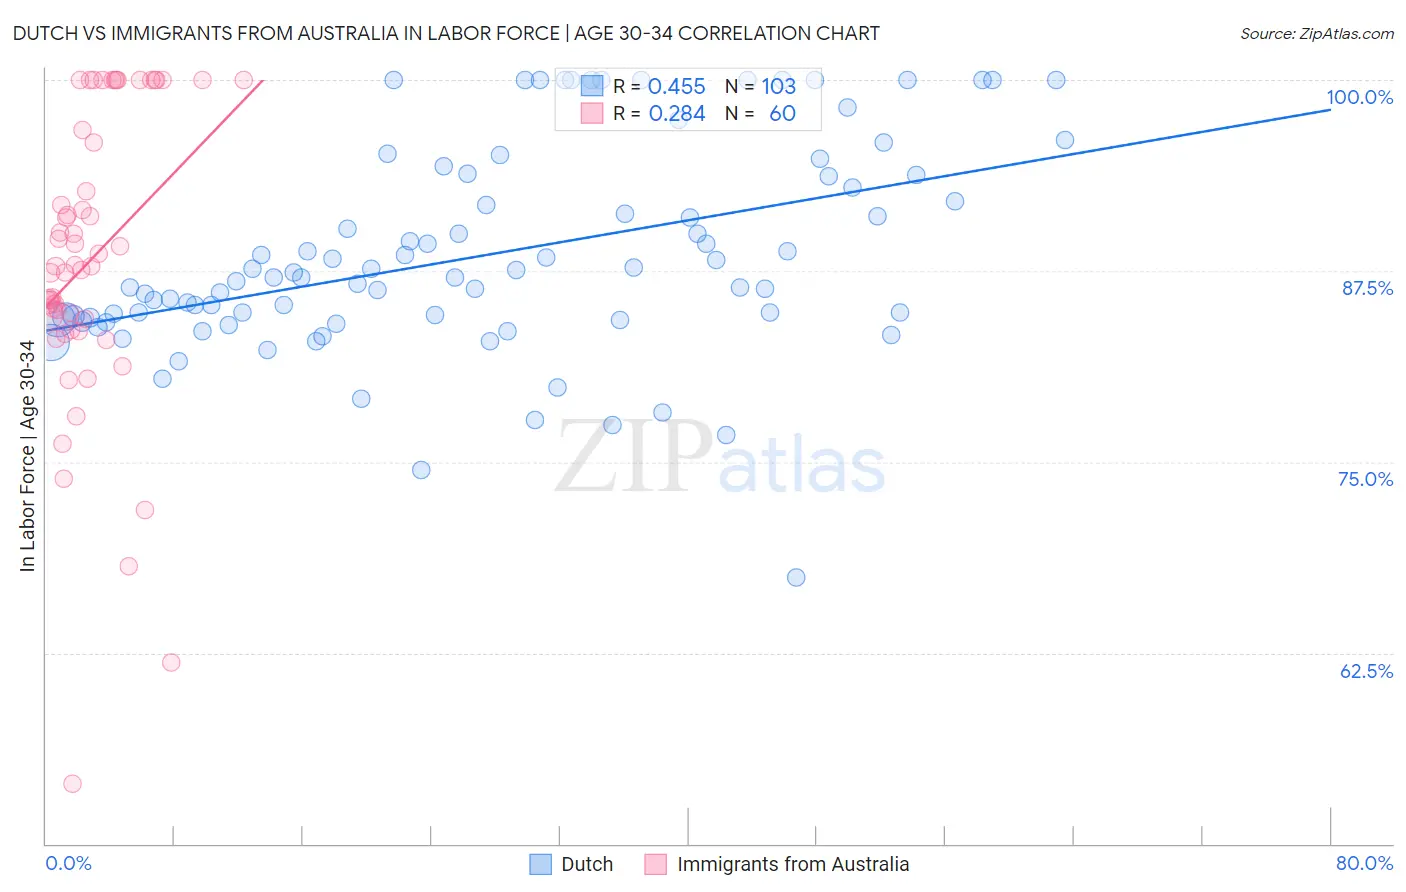
Dutch vs Immigrants from Australia In Labor Force | Age 30-34 Correlation Chart
The statistical analysis conducted on geographies consisting of 553,365,040 people shows a moderate positive correlation between the proportion of Dutch and labor force participation rate among population between the ages 30 and 34 in the United States with a correlation coefficient (R) of 0.455 and weighted average of 84.5%. Similarly, the statistical analysis conducted on geographies consisting of 227,147,173 people shows a weak positive correlation between the proportion of Immigrants from Australia and labor force participation rate among population between the ages 30 and 34 in the United States with a correlation coefficient (R) of 0.284 and weighted average of 85.6%, a difference of 1.3%.
In Labor Force | Age 30-34 Correlation Summary
| Measurement | Dutch | Immigrants from Australia |
| Minimum | 67.4% | 53.9% |
| Maximum | 100.0% | 100.0% |
| Range | 32.6% | 46.1% |
| Mean | 88.5% | 88.3% |
| Median | 87.0% | 87.9% |
| Interquartile 25% (IQ1) | 84.3% | 84.0% |
| Interquartile 75% (IQ3) | 93.7% | 98.4% |
| Interquartile Range (IQR) | 9.4% | 14.4% |
| Standard Deviation (Sample) | 6.7% | 9.8% |
| Standard Deviation (Population) | 6.7% | 9.7% |
Similar Demographics by In Labor Force | Age 30-34
Demographics Similar to Dutch by In Labor Force | Age 30-34
In terms of in labor force | age 30-34, the demographic groups most similar to Dutch are Immigrants from Thailand (84.5%, a difference of 0.010%), Subsaharan African (84.5%, a difference of 0.010%), Immigrants from Syria (84.5%, a difference of 0.020%), Trinidadian and Tobagonian (84.5%, a difference of 0.020%), and Immigrants from West Indies (84.5%, a difference of 0.020%).
| Demographics | Rating | Rank | In Labor Force | Age 30-34 |
| Hungarians | 24.8 /100 | #191 | Fair 84.5% |
| Scandinavians | 24.7 /100 | #192 | Fair 84.5% |
| Immigrants | Costa Rica | 23.9 /100 | #193 | Fair 84.5% |
| Immigrants | Afghanistan | 23.5 /100 | #194 | Fair 84.5% |
| Koreans | 23.2 /100 | #195 | Fair 84.5% |
| British | 22.9 /100 | #196 | Fair 84.5% |
| Immigrants | Syria | 21.9 /100 | #197 | Fair 84.5% |
| Dutch | 20.2 /100 | #198 | Fair 84.5% |
| Immigrants | Thailand | 19.1 /100 | #199 | Poor 84.5% |
| Sub-Saharan Africans | 19.0 /100 | #200 | Poor 84.5% |
| Trinidadians and Tobagonians | 18.2 /100 | #201 | Poor 84.5% |
| Immigrants | West Indies | 18.1 /100 | #202 | Poor 84.5% |
| Canadians | 15.4 /100 | #203 | Poor 84.4% |
| Ecuadorians | 14.2 /100 | #204 | Poor 84.4% |
| French | 13.8 /100 | #205 | Poor 84.4% |
Demographics Similar to Immigrants from Australia by In Labor Force | Age 30-34
In terms of in labor force | age 30-34, the demographic groups most similar to Immigrants from Australia are Immigrants from Sweden (85.6%, a difference of 0.010%), Lithuanian (85.6%, a difference of 0.010%), Cape Verdean (85.6%, a difference of 0.020%), Immigrants from Morocco (85.6%, a difference of 0.030%), and Croatian (85.6%, a difference of 0.030%).
| Demographics | Rating | Rank | In Labor Force | Age 30-34 |
| Immigrants | Lithuania | 99.8 /100 | #43 | Exceptional 85.6% |
| Immigrants | Sri Lanka | 99.8 /100 | #44 | Exceptional 85.6% |
| Immigrants | Nepal | 99.8 /100 | #45 | Exceptional 85.6% |
| Immigrants | Morocco | 99.8 /100 | #46 | Exceptional 85.6% |
| Croatians | 99.8 /100 | #47 | Exceptional 85.6% |
| Immigrants | Sweden | 99.8 /100 | #48 | Exceptional 85.6% |
| Lithuanians | 99.8 /100 | #49 | Exceptional 85.6% |
| Immigrants | Australia | 99.8 /100 | #50 | Exceptional 85.6% |
| Cape Verdeans | 99.7 /100 | #51 | Exceptional 85.6% |
| Slovenes | 99.7 /100 | #52 | Exceptional 85.6% |
| Filipinos | 99.6 /100 | #53 | Exceptional 85.5% |
| Immigrants | Kenya | 99.6 /100 | #54 | Exceptional 85.5% |
| Immigrants | Turkey | 99.6 /100 | #55 | Exceptional 85.5% |
| Czechs | 99.6 /100 | #56 | Exceptional 85.5% |
| Russians | 99.6 /100 | #57 | Exceptional 85.5% |