Navajo vs Immigrants from Norway In Labor Force | Age 30-34
COMPARE
Navajo
Immigrants from Norway
In Labor Force | Age 30-34
In Labor Force | Age 30-34 Comparison
Navajo
Immigrants from Norway
73.8%
IN LABOR FORCE | AGE 30-34
0.0/ 100
METRIC RATING
347th/ 347
METRIC RANK
85.2%
IN LABOR FORCE | AGE 30-34
97.6/ 100
METRIC RATING
93rd/ 347
METRIC RANK
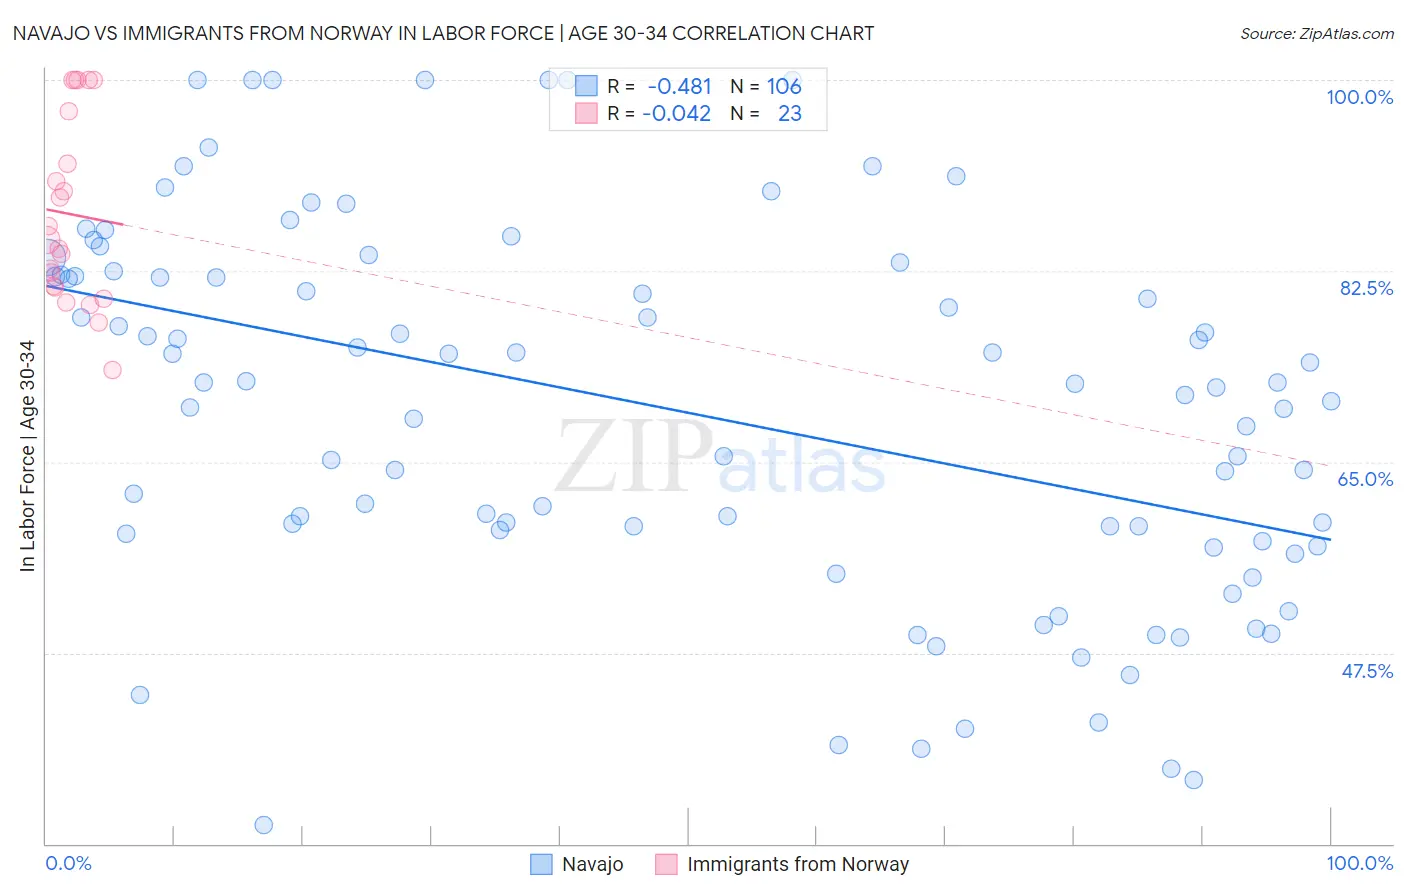
Navajo vs Immigrants from Norway In Labor Force | Age 30-34 Correlation Chart
The statistical analysis conducted on geographies consisting of 224,771,118 people shows a moderate negative correlation between the proportion of Navajo and labor force participation rate among population between the ages 30 and 34 in the United States with a correlation coefficient (R) of -0.481 and weighted average of 73.8%. Similarly, the statistical analysis conducted on geographies consisting of 116,700,143 people shows no correlation between the proportion of Immigrants from Norway and labor force participation rate among population between the ages 30 and 34 in the United States with a correlation coefficient (R) of -0.042 and weighted average of 85.2%, a difference of 15.6%.
In Labor Force | Age 30-34 Correlation Summary
| Measurement | Navajo | Immigrants from Norway |
| Minimum | 31.7% | 73.4% |
| Maximum | 100.0% | 100.0% |
| Range | 68.3% | 26.6% |
| Mean | 69.8% | 87.7% |
| Median | 72.0% | 85.4% |
| Interquartile 25% (IQ1) | 58.5% | 81.0% |
| Interquartile 75% (IQ3) | 82.0% | 97.2% |
| Interquartile Range (IQR) | 23.6% | 16.2% |
| Standard Deviation (Sample) | 16.9% | 8.4% |
| Standard Deviation (Population) | 16.8% | 8.2% |
Similar Demographics by In Labor Force | Age 30-34
Demographics Similar to Navajo by In Labor Force | Age 30-34
In terms of in labor force | age 30-34, the demographic groups most similar to Navajo are Crow (75.9%, a difference of 2.9%), Yup'ik (76.4%, a difference of 3.6%), Yuman (77.1%, a difference of 4.5%), Lumbee (77.3%, a difference of 4.8%), and Tohono O'odham (77.7%, a difference of 5.4%).
| Demographics | Rating | Rank | In Labor Force | Age 30-34 |
| Inupiat | 0.0 /100 | #333 | Tragic 79.7% |
| Hopi | 0.0 /100 | #334 | Tragic 79.3% |
| Marshallese | 0.0 /100 | #335 | Tragic 79.2% |
| Natives/Alaskans | 0.0 /100 | #336 | Tragic 79.2% |
| Yakama | 0.0 /100 | #337 | Tragic 79.1% |
| Pima | 0.0 /100 | #338 | Tragic 79.0% |
| Apache | 0.0 /100 | #339 | Tragic 79.0% |
| Ute | 0.0 /100 | #340 | Tragic 78.9% |
| Immigrants | Yemen | 0.0 /100 | #341 | Tragic 78.2% |
| Tohono O'odham | 0.0 /100 | #342 | Tragic 77.7% |
| Lumbee | 0.0 /100 | #343 | Tragic 77.3% |
| Yuman | 0.0 /100 | #344 | Tragic 77.1% |
| Yup'ik | 0.0 /100 | #345 | Tragic 76.4% |
| Crow | 0.0 /100 | #346 | Tragic 75.9% |
| Navajo | 0.0 /100 | #347 | Tragic 73.8% |
Demographics Similar to Immigrants from Norway by In Labor Force | Age 30-34
In terms of in labor force | age 30-34, the demographic groups most similar to Immigrants from Norway are German Russian (85.2%, a difference of 0.010%), Swedish (85.2%, a difference of 0.010%), Immigrants from India (85.2%, a difference of 0.010%), Immigrants from Moldova (85.3%, a difference of 0.020%), and Immigrants from Korea (85.2%, a difference of 0.020%).
| Demographics | Rating | Rank | In Labor Force | Age 30-34 |
| Immigrants | Taiwan | 98.3 /100 | #86 | Exceptional 85.3% |
| Immigrants | Northern Europe | 98.2 /100 | #87 | Exceptional 85.3% |
| Immigrants | Belgium | 98.2 /100 | #88 | Exceptional 85.3% |
| Immigrants | Kazakhstan | 98.1 /100 | #89 | Exceptional 85.3% |
| Burmese | 97.9 /100 | #90 | Exceptional 85.3% |
| Immigrants | Moldova | 97.9 /100 | #91 | Exceptional 85.3% |
| German Russians | 97.7 /100 | #92 | Exceptional 85.2% |
| Immigrants | Norway | 97.6 /100 | #93 | Exceptional 85.2% |
| Swedes | 97.5 /100 | #94 | Exceptional 85.2% |
| Immigrants | India | 97.4 /100 | #95 | Exceptional 85.2% |
| Immigrants | Korea | 97.3 /100 | #96 | Exceptional 85.2% |
| Thais | 97.2 /100 | #97 | Exceptional 85.2% |
| Immigrants | Uganda | 97.2 /100 | #98 | Exceptional 85.2% |
| Belgians | 97.2 /100 | #99 | Exceptional 85.2% |
| Sudanese | 97.1 /100 | #100 | Exceptional 85.2% |