Ecuadorian vs Yugoslavian In Labor Force | Age 20-64
COMPARE
Ecuadorian
Yugoslavian
In Labor Force | Age 20-64
In Labor Force | Age 20-64 Comparison
Ecuadorians
Yugoslavians
79.4%
IN LABOR FORCE | AGE 20-64
23.1/ 100
METRIC RATING
196th/ 347
METRIC RANK
80.1%
IN LABOR FORCE | AGE 20-64
95.9/ 100
METRIC RATING
95th/ 347
METRIC RANK
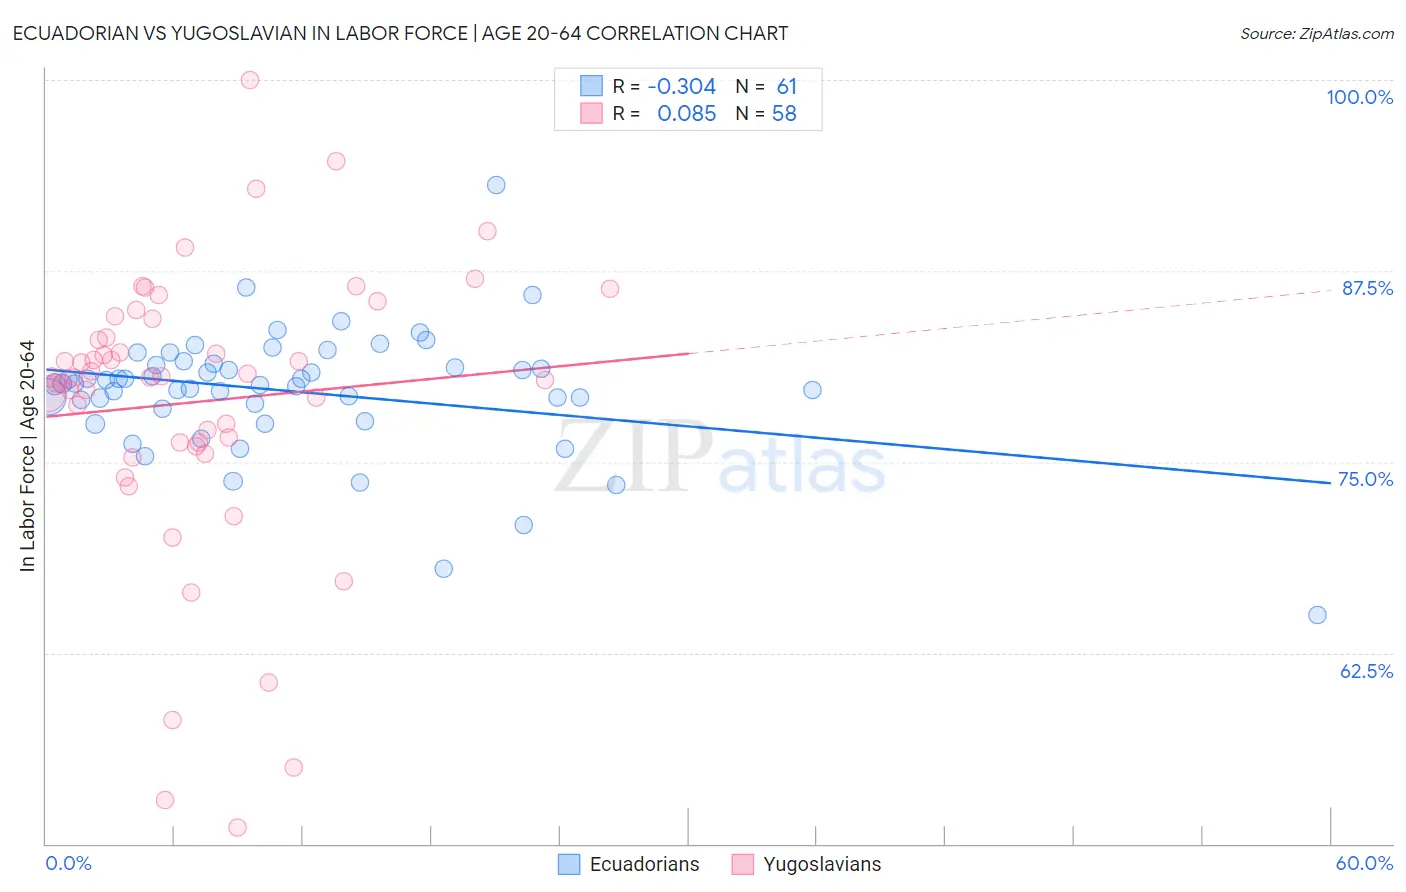
Ecuadorian vs Yugoslavian In Labor Force | Age 20-64 Correlation Chart
The statistical analysis conducted on geographies consisting of 317,839,465 people shows a mild negative correlation between the proportion of Ecuadorians and labor force participation rate among population between the ages 20 and 64 in the United States with a correlation coefficient (R) of -0.304 and weighted average of 79.4%. Similarly, the statistical analysis conducted on geographies consisting of 285,716,744 people shows a slight positive correlation between the proportion of Yugoslavians and labor force participation rate among population between the ages 20 and 64 in the United States with a correlation coefficient (R) of 0.085 and weighted average of 80.1%, a difference of 0.88%.
In Labor Force | Age 20-64 Correlation Summary
| Measurement | Ecuadorian | Yugoslavian |
| Minimum | 65.0% | 51.1% |
| Maximum | 93.1% | 100.0% |
| Range | 28.1% | 48.9% |
| Mean | 79.6% | 78.9% |
| Median | 80.1% | 80.5% |
| Interquartile 25% (IQ1) | 78.7% | 76.3% |
| Interquartile 75% (IQ3) | 81.4% | 84.3% |
| Interquartile Range (IQR) | 2.7% | 8.0% |
| Standard Deviation (Sample) | 4.1% | 9.4% |
| Standard Deviation (Population) | 4.1% | 9.3% |
Similar Demographics by In Labor Force | Age 20-64
Demographics Similar to Ecuadorians by In Labor Force | Age 20-64
In terms of in labor force | age 20-64, the demographic groups most similar to Ecuadorians are Immigrants from Austria (79.4%, a difference of 0.010%), Immigrants from Senegal (79.4%, a difference of 0.010%), Immigrants from Thailand (79.4%, a difference of 0.020%), Immigrants from Laos (79.4%, a difference of 0.020%), and Indonesian (79.4%, a difference of 0.030%).
| Demographics | Rating | Rank | In Labor Force | Age 20-64 |
| Immigrants | El Salvador | 30.9 /100 | #189 | Fair 79.4% |
| Immigrants | Syria | 30.8 /100 | #190 | Fair 79.4% |
| Swiss | 28.9 /100 | #191 | Fair 79.4% |
| Immigrants | Denmark | 26.9 /100 | #192 | Fair 79.4% |
| Indonesians | 26.1 /100 | #193 | Fair 79.4% |
| Immigrants | Thailand | 24.8 /100 | #194 | Fair 79.4% |
| Immigrants | Austria | 23.7 /100 | #195 | Fair 79.4% |
| Ecuadorians | 23.1 /100 | #196 | Fair 79.4% |
| Immigrants | Senegal | 22.5 /100 | #197 | Fair 79.4% |
| Immigrants | Laos | 21.5 /100 | #198 | Fair 79.4% |
| Dutch | 20.2 /100 | #199 | Fair 79.3% |
| Immigrants | Oceania | 19.1 /100 | #200 | Poor 79.3% |
| Immigrants | Nicaragua | 19.0 /100 | #201 | Poor 79.3% |
| Nicaraguans | 18.3 /100 | #202 | Poor 79.3% |
| Iraqis | 17.7 /100 | #203 | Poor 79.3% |
Demographics Similar to Yugoslavians by In Labor Force | Age 20-64
In terms of in labor force | age 20-64, the demographic groups most similar to Yugoslavians are Immigrants from Malaysia (80.1%, a difference of 0.0%), South American (80.1%, a difference of 0.0%), Immigrants from Uruguay (80.1%, a difference of 0.0%), Immigrants from Asia (80.1%, a difference of 0.010%), and Immigrants from Chile (80.1%, a difference of 0.010%).
| Demographics | Rating | Rank | In Labor Force | Age 20-64 |
| Chileans | 97.0 /100 | #88 | Exceptional 80.1% |
| Immigrants | Venezuela | 96.8 /100 | #89 | Exceptional 80.1% |
| Poles | 96.8 /100 | #90 | Exceptional 80.1% |
| Uruguayans | 96.7 /100 | #91 | Exceptional 80.1% |
| Ghanaians | 96.7 /100 | #92 | Exceptional 80.1% |
| Immigrants | Belarus | 96.4 /100 | #93 | Exceptional 80.1% |
| Immigrants | Asia | 96.0 /100 | #94 | Exceptional 80.1% |
| Yugoslavians | 95.9 /100 | #95 | Exceptional 80.1% |
| Immigrants | Malaysia | 95.9 /100 | #96 | Exceptional 80.1% |
| South Americans | 95.9 /100 | #97 | Exceptional 80.1% |
| Immigrants | Uruguay | 95.8 /100 | #98 | Exceptional 80.1% |
| Immigrants | Chile | 95.7 /100 | #99 | Exceptional 80.1% |
| Filipinos | 95.6 /100 | #100 | Exceptional 80.1% |
| Palestinians | 95.5 /100 | #101 | Exceptional 80.0% |
| Immigrants | Australia | 95.5 /100 | #102 | Exceptional 80.0% |