Argentinean vs Immigrants from Armenia In Labor Force | Age 20-64
COMPARE
Argentinean
Immigrants from Armenia
In Labor Force | Age 20-64
In Labor Force | Age 20-64 Comparison
Argentineans
Immigrants from Armenia
80.0%
IN LABOR FORCE | AGE 20-64
93.8/ 100
METRIC RATING
114th/ 347
METRIC RANK
79.2%
IN LABOR FORCE | AGE 20-64
12.2/ 100
METRIC RATING
214th/ 347
METRIC RANK
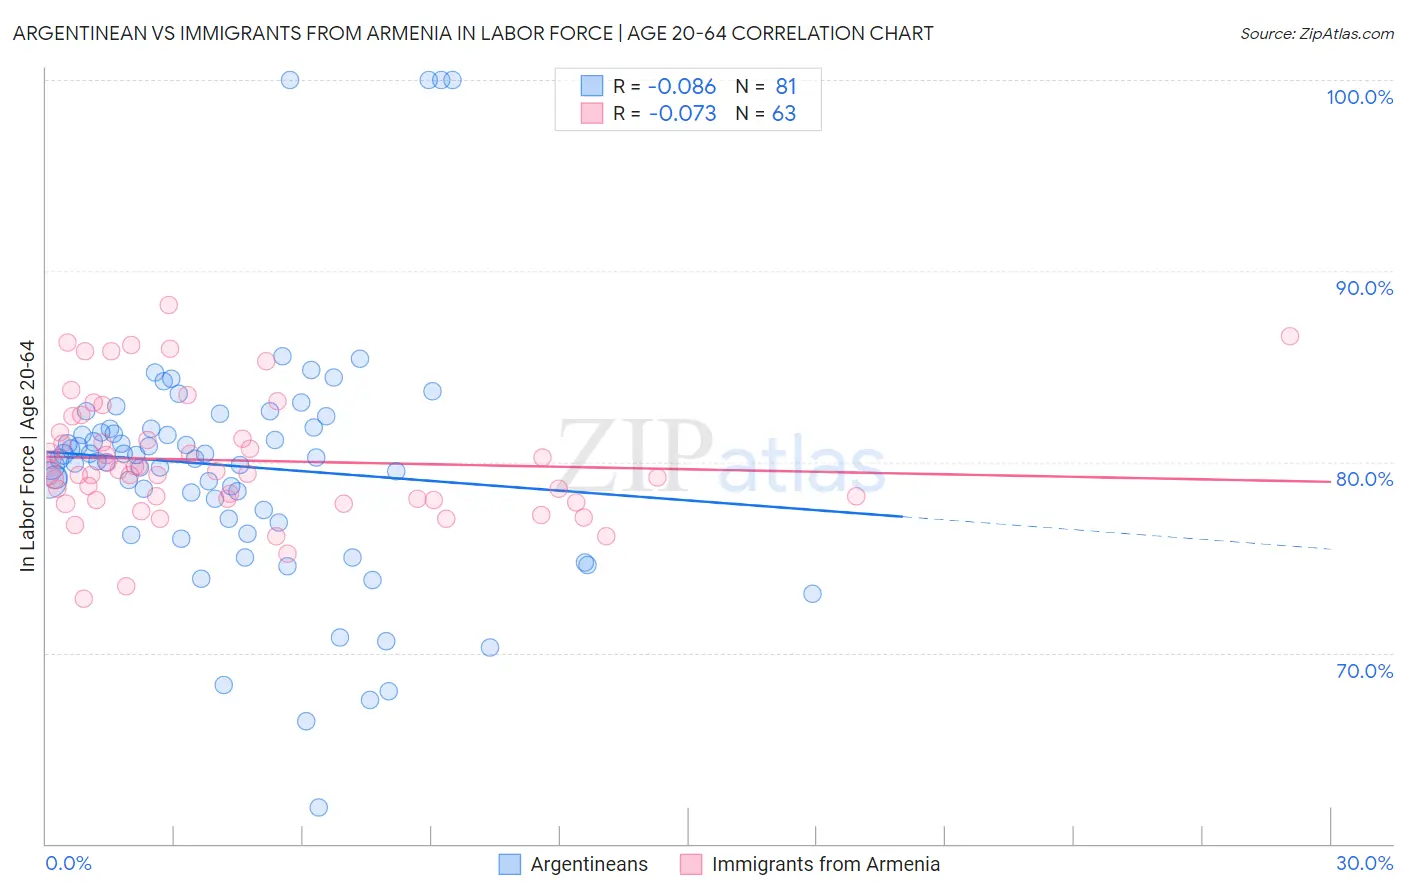
Argentinean vs Immigrants from Armenia In Labor Force | Age 20-64 Correlation Chart
The statistical analysis conducted on geographies consisting of 297,148,532 people shows a slight negative correlation between the proportion of Argentineans and labor force participation rate among population between the ages 20 and 64 in the United States with a correlation coefficient (R) of -0.086 and weighted average of 80.0%. Similarly, the statistical analysis conducted on geographies consisting of 97,718,343 people shows a slight negative correlation between the proportion of Immigrants from Armenia and labor force participation rate among population between the ages 20 and 64 in the United States with a correlation coefficient (R) of -0.073 and weighted average of 79.2%, a difference of 0.95%.
In Labor Force | Age 20-64 Correlation Summary
| Measurement | Argentinean | Immigrants from Armenia |
| Minimum | 61.9% | 72.8% |
| Maximum | 100.0% | 88.2% |
| Range | 38.1% | 15.4% |
| Mean | 79.8% | 80.1% |
| Median | 80.2% | 79.5% |
| Interquartile 25% (IQ1) | 76.9% | 78.0% |
| Interquartile 75% (IQ3) | 81.8% | 81.5% |
| Interquartile Range (IQR) | 4.9% | 3.5% |
| Standard Deviation (Sample) | 6.5% | 3.2% |
| Standard Deviation (Population) | 6.5% | 3.2% |
Similar Demographics by In Labor Force | Age 20-64
Demographics Similar to Argentineans by In Labor Force | Age 20-64
In terms of in labor force | age 20-64, the demographic groups most similar to Argentineans are Immigrants from Italy (80.0%, a difference of 0.0%), Sri Lankan (80.0%, a difference of 0.0%), Immigrants from Argentina (80.0%, a difference of 0.010%), Estonian (80.0%, a difference of 0.010%), and Immigrants from South America (80.0%, a difference of 0.010%).
| Demographics | Rating | Rank | In Labor Force | Age 20-64 |
| Immigrants | Jordan | 94.8 /100 | #107 | Exceptional 80.0% |
| Iranians | 94.3 /100 | #108 | Exceptional 80.0% |
| Immigrants | Argentina | 94.1 /100 | #109 | Exceptional 80.0% |
| Estonians | 94.0 /100 | #110 | Exceptional 80.0% |
| Immigrants | South America | 93.9 /100 | #111 | Exceptional 80.0% |
| Immigrants | Italy | 93.9 /100 | #112 | Exceptional 80.0% |
| Sri Lankans | 93.9 /100 | #113 | Exceptional 80.0% |
| Argentineans | 93.8 /100 | #114 | Exceptional 80.0% |
| Bermudans | 93.3 /100 | #115 | Exceptional 80.0% |
| Immigrants | Western Africa | 93.1 /100 | #116 | Exceptional 80.0% |
| Immigrants | Vietnam | 92.7 /100 | #117 | Exceptional 80.0% |
| Cape Verdeans | 92.7 /100 | #118 | Exceptional 80.0% |
| Immigrants | Taiwan | 92.5 /100 | #119 | Exceptional 80.0% |
| Maltese | 92.4 /100 | #120 | Exceptional 80.0% |
| Immigrants | Kuwait | 92.2 /100 | #121 | Exceptional 80.0% |
Demographics Similar to Immigrants from Armenia by In Labor Force | Age 20-64
In terms of in labor force | age 20-64, the demographic groups most similar to Immigrants from Armenia are Immigrants from Norway (79.2%, a difference of 0.0%), Immigrants from Portugal (79.3%, a difference of 0.010%), Arab (79.2%, a difference of 0.010%), Irish (79.3%, a difference of 0.020%), and Immigrants from Western Asia (79.2%, a difference of 0.020%).
| Demographics | Rating | Rank | In Labor Force | Age 20-64 |
| Sub-Saharan Africans | 16.5 /100 | #207 | Poor 79.3% |
| British | 16.5 /100 | #208 | Poor 79.3% |
| Bangladeshis | 16.4 /100 | #209 | Poor 79.3% |
| Haitians | 16.1 /100 | #210 | Poor 79.3% |
| Europeans | 15.3 /100 | #211 | Poor 79.3% |
| Irish | 13.2 /100 | #212 | Poor 79.3% |
| Immigrants | Portugal | 12.8 /100 | #213 | Poor 79.3% |
| Immigrants | Armenia | 12.2 /100 | #214 | Poor 79.2% |
| Immigrants | Norway | 12.0 /100 | #215 | Poor 79.2% |
| Arabs | 11.4 /100 | #216 | Poor 79.2% |
| Immigrants | Western Asia | 11.0 /100 | #217 | Poor 79.2% |
| Immigrants | England | 9.3 /100 | #218 | Tragic 79.2% |
| French Canadians | 8.4 /100 | #219 | Tragic 79.2% |
| Immigrants | Immigrants | 7.7 /100 | #220 | Tragic 79.2% |
| Hungarians | 7.2 /100 | #221 | Tragic 79.2% |