Immigrants from Laos vs Immigrants from Armenia In Labor Force | Age 20-64
COMPARE
Immigrants from Laos
Immigrants from Armenia
In Labor Force | Age 20-64
In Labor Force | Age 20-64 Comparison
Immigrants from Laos
Immigrants from Armenia
79.4%
IN LABOR FORCE | AGE 20-64
21.5/ 100
METRIC RATING
198th/ 347
METRIC RANK
79.2%
IN LABOR FORCE | AGE 20-64
12.2/ 100
METRIC RATING
214th/ 347
METRIC RANK
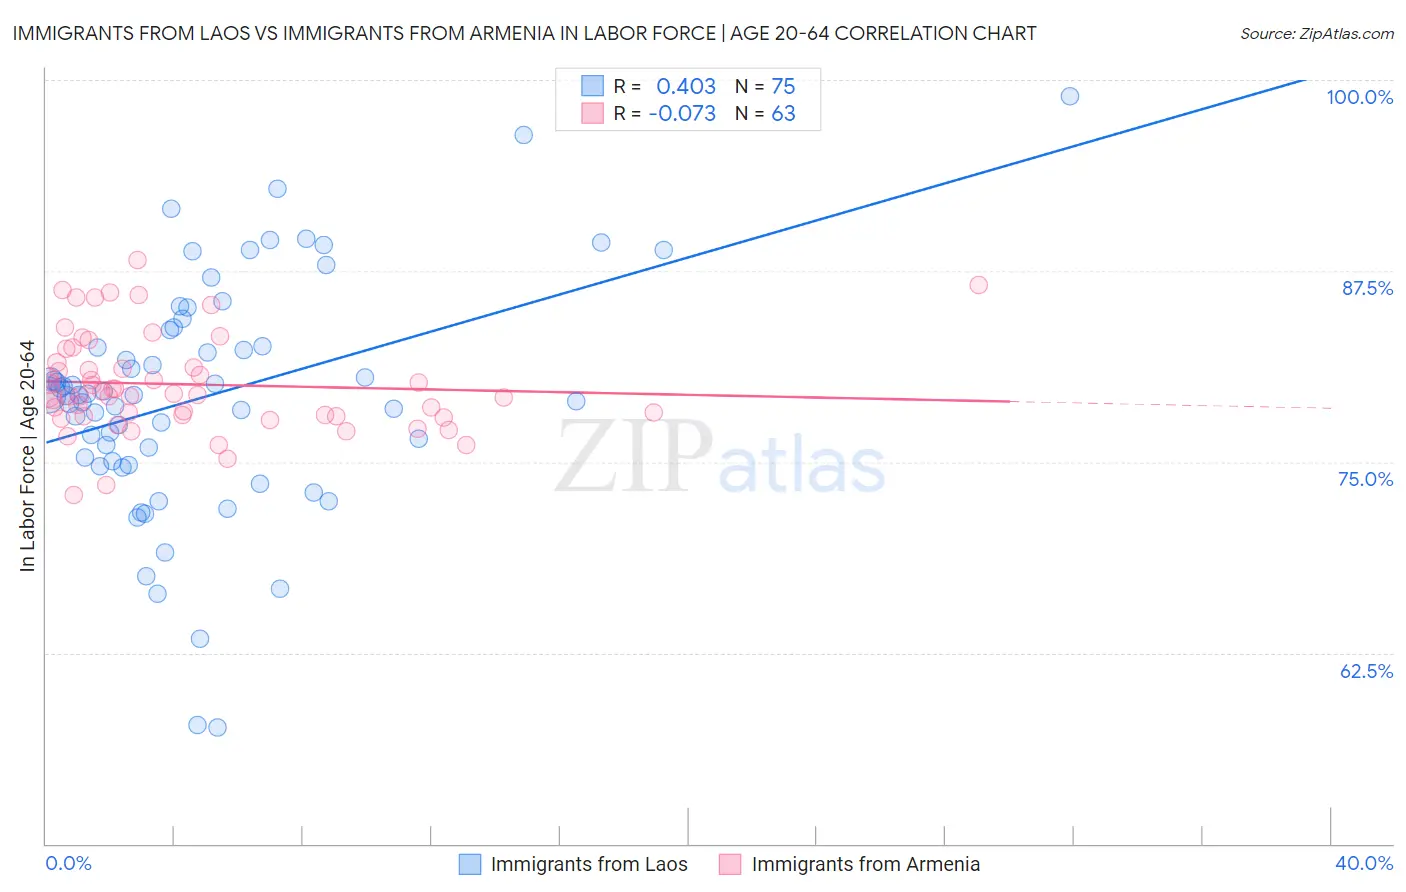
Immigrants from Laos vs Immigrants from Armenia In Labor Force | Age 20-64 Correlation Chart
The statistical analysis conducted on geographies consisting of 201,472,341 people shows a moderate positive correlation between the proportion of Immigrants from Laos and labor force participation rate among population between the ages 20 and 64 in the United States with a correlation coefficient (R) of 0.403 and weighted average of 79.4%. Similarly, the statistical analysis conducted on geographies consisting of 97,718,343 people shows a slight negative correlation between the proportion of Immigrants from Armenia and labor force participation rate among population between the ages 20 and 64 in the United States with a correlation coefficient (R) of -0.073 and weighted average of 79.2%, a difference of 0.14%.
In Labor Force | Age 20-64 Correlation Summary
| Measurement | Immigrants from Laos | Immigrants from Armenia |
| Minimum | 57.6% | 72.8% |
| Maximum | 98.9% | 88.2% |
| Range | 41.3% | 15.4% |
| Mean | 79.3% | 80.1% |
| Median | 79.4% | 79.5% |
| Interquartile 25% (IQ1) | 75.1% | 78.0% |
| Interquartile 75% (IQ3) | 83.6% | 81.5% |
| Interquartile Range (IQR) | 8.5% | 3.5% |
| Standard Deviation (Sample) | 7.7% | 3.2% |
| Standard Deviation (Population) | 7.6% | 3.2% |
Demographics Similar to Immigrants from Laos and Immigrants from Armenia by In Labor Force | Age 20-64
In terms of in labor force | age 20-64, the demographic groups most similar to Immigrants from Laos are Immigrants from Senegal (79.4%, a difference of 0.010%), Ecuadorian (79.4%, a difference of 0.020%), Dutch (79.3%, a difference of 0.020%), Immigrants from Oceania (79.3%, a difference of 0.030%), and Immigrants from Nicaragua (79.3%, a difference of 0.030%). Similarly, the demographic groups most similar to Immigrants from Armenia are Immigrants from Norway (79.2%, a difference of 0.0%), Immigrants from Portugal (79.3%, a difference of 0.010%), Arab (79.2%, a difference of 0.010%), Irish (79.3%, a difference of 0.020%), and European (79.3%, a difference of 0.050%).
| Demographics | Rating | Rank | In Labor Force | Age 20-64 |
| Ecuadorians | 23.1 /100 | #196 | Fair 79.4% |
| Immigrants | Senegal | 22.5 /100 | #197 | Fair 79.4% |
| Immigrants | Laos | 21.5 /100 | #198 | Fair 79.4% |
| Dutch | 20.2 /100 | #199 | Fair 79.3% |
| Immigrants | Oceania | 19.1 /100 | #200 | Poor 79.3% |
| Immigrants | Nicaragua | 19.0 /100 | #201 | Poor 79.3% |
| Nicaraguans | 18.3 /100 | #202 | Poor 79.3% |
| Iraqis | 17.7 /100 | #203 | Poor 79.3% |
| Immigrants | Cambodia | 17.6 /100 | #204 | Poor 79.3% |
| Immigrants | Congo | 17.5 /100 | #205 | Poor 79.3% |
| Immigrants | Ecuador | 16.9 /100 | #206 | Poor 79.3% |
| Sub-Saharan Africans | 16.5 /100 | #207 | Poor 79.3% |
| British | 16.5 /100 | #208 | Poor 79.3% |
| Bangladeshis | 16.4 /100 | #209 | Poor 79.3% |
| Haitians | 16.1 /100 | #210 | Poor 79.3% |
| Europeans | 15.3 /100 | #211 | Poor 79.3% |
| Irish | 13.2 /100 | #212 | Poor 79.3% |
| Immigrants | Portugal | 12.8 /100 | #213 | Poor 79.3% |
| Immigrants | Armenia | 12.2 /100 | #214 | Poor 79.2% |
| Immigrants | Norway | 12.0 /100 | #215 | Poor 79.2% |
| Arabs | 11.4 /100 | #216 | Poor 79.2% |