Native Hawaiian vs Carpatho Rusyn In Labor Force | Age 20-24
COMPARE
Native Hawaiian
Carpatho Rusyn
In Labor Force | Age 20-24
In Labor Force | Age 20-24 Comparison
Native Hawaiians
Carpatho Rusyns
77.4%
IN LABOR FORCE | AGE 20-24
100.0/ 100
METRIC RATING
45th/ 347
METRIC RANK
76.5%
IN LABOR FORCE | AGE 20-24
99.4/ 100
METRIC RATING
83rd/ 347
METRIC RANK
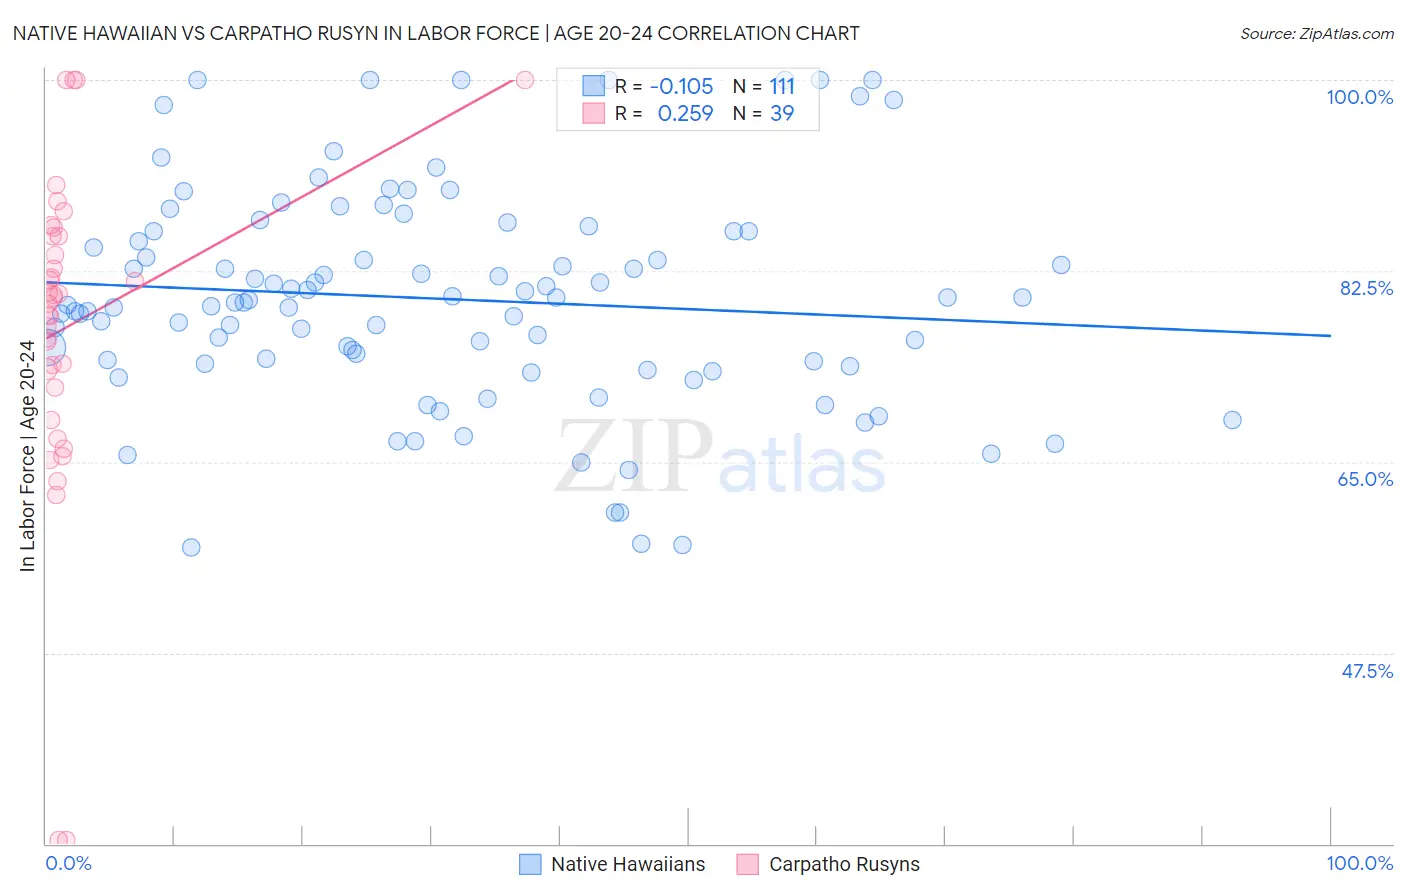
Native Hawaiian vs Carpatho Rusyn In Labor Force | Age 20-24 Correlation Chart
The statistical analysis conducted on geographies consisting of 331,991,642 people shows a poor negative correlation between the proportion of Native Hawaiians and labor force participation rate among population between the ages 20 and 24 in the United States with a correlation coefficient (R) of -0.105 and weighted average of 77.4%. Similarly, the statistical analysis conducted on geographies consisting of 58,856,005 people shows a weak positive correlation between the proportion of Carpatho Rusyns and labor force participation rate among population between the ages 20 and 24 in the United States with a correlation coefficient (R) of 0.259 and weighted average of 76.5%, a difference of 1.2%.
In Labor Force | Age 20-24 Correlation Summary
| Measurement | Native Hawaiian | Carpatho Rusyn |
| Minimum | 57.1% | 30.4% |
| Maximum | 100.0% | 100.0% |
| Range | 42.9% | 69.6% |
| Mean | 79.9% | 77.5% |
| Median | 79.6% | 80.0% |
| Interquartile 25% (IQ1) | 74.0% | 71.9% |
| Interquartile 75% (IQ3) | 86.1% | 85.7% |
| Interquartile Range (IQR) | 12.1% | 13.8% |
| Standard Deviation (Sample) | 9.9% | 14.9% |
| Standard Deviation (Population) | 9.9% | 14.7% |
Similar Demographics by In Labor Force | Age 20-24
Demographics Similar to Native Hawaiians by In Labor Force | Age 20-24
In terms of in labor force | age 20-24, the demographic groups most similar to Native Hawaiians are Fijian (77.4%, a difference of 0.010%), Samoan (77.4%, a difference of 0.010%), Immigrants from Laos (77.4%, a difference of 0.020%), French (77.4%, a difference of 0.030%), and Immigrants from Congo (77.4%, a difference of 0.040%).
| Demographics | Rating | Rank | In Labor Force | Age 20-24 |
| Marshallese | 100.0 /100 | #38 | Exceptional 77.4% |
| Irish | 100.0 /100 | #39 | Exceptional 77.4% |
| Scottish | 100.0 /100 | #40 | Exceptional 77.4% |
| Immigrants | Congo | 100.0 /100 | #41 | Exceptional 77.4% |
| French | 100.0 /100 | #42 | Exceptional 77.4% |
| Immigrants | Laos | 100.0 /100 | #43 | Exceptional 77.4% |
| Fijians | 100.0 /100 | #44 | Exceptional 77.4% |
| Native Hawaiians | 100.0 /100 | #45 | Exceptional 77.4% |
| Samoans | 100.0 /100 | #46 | Exceptional 77.4% |
| Ethiopians | 100.0 /100 | #47 | Exceptional 77.3% |
| Serbians | 100.0 /100 | #48 | Exceptional 77.3% |
| Chinese | 100.0 /100 | #49 | Exceptional 77.3% |
| Malaysians | 100.0 /100 | #50 | Exceptional 77.2% |
| Croatians | 100.0 /100 | #51 | Exceptional 77.2% |
| Indonesians | 100.0 /100 | #52 | Exceptional 77.2% |
Demographics Similar to Carpatho Rusyns by In Labor Force | Age 20-24
In terms of in labor force | age 20-24, the demographic groups most similar to Carpatho Rusyns are Austrian (76.5%, a difference of 0.010%), Portuguese (76.4%, a difference of 0.040%), Immigrants from Iraq (76.4%, a difference of 0.060%), Immigrants from Thailand (76.4%, a difference of 0.060%), and Basque (76.5%, a difference of 0.090%).
| Demographics | Rating | Rank | In Labor Force | Age 20-24 |
| Immigrants | Moldova | 99.6 /100 | #76 | Exceptional 76.6% |
| Immigrants | Cameroon | 99.6 /100 | #77 | Exceptional 76.6% |
| Canadians | 99.6 /100 | #78 | Exceptional 76.6% |
| Immigrants | Zaire | 99.6 /100 | #79 | Exceptional 76.6% |
| Italians | 99.6 /100 | #80 | Exceptional 76.5% |
| Basques | 99.5 /100 | #81 | Exceptional 76.5% |
| Hmong | 99.5 /100 | #82 | Exceptional 76.5% |
| Carpatho Rusyns | 99.4 /100 | #83 | Exceptional 76.5% |
| Austrians | 99.4 /100 | #84 | Exceptional 76.5% |
| Portuguese | 99.3 /100 | #85 | Exceptional 76.4% |
| Immigrants | Iraq | 99.3 /100 | #86 | Exceptional 76.4% |
| Immigrants | Thailand | 99.3 /100 | #87 | Exceptional 76.4% |
| Spanish | 99.2 /100 | #88 | Exceptional 76.4% |
| Bulgarians | 99.2 /100 | #89 | Exceptional 76.4% |
| Immigrants | Burma/Myanmar | 99.1 /100 | #90 | Exceptional 76.3% |