Bahamian vs Carpatho Rusyn In Labor Force | Age 20-24
COMPARE
Bahamian
Carpatho Rusyn
In Labor Force | Age 20-24
In Labor Force | Age 20-24 Comparison
Bahamians
Carpatho Rusyns
73.3%
IN LABOR FORCE | AGE 20-24
0.1/ 100
METRIC RATING
280th/ 347
METRIC RANK
76.5%
IN LABOR FORCE | AGE 20-24
99.4/ 100
METRIC RATING
83rd/ 347
METRIC RANK
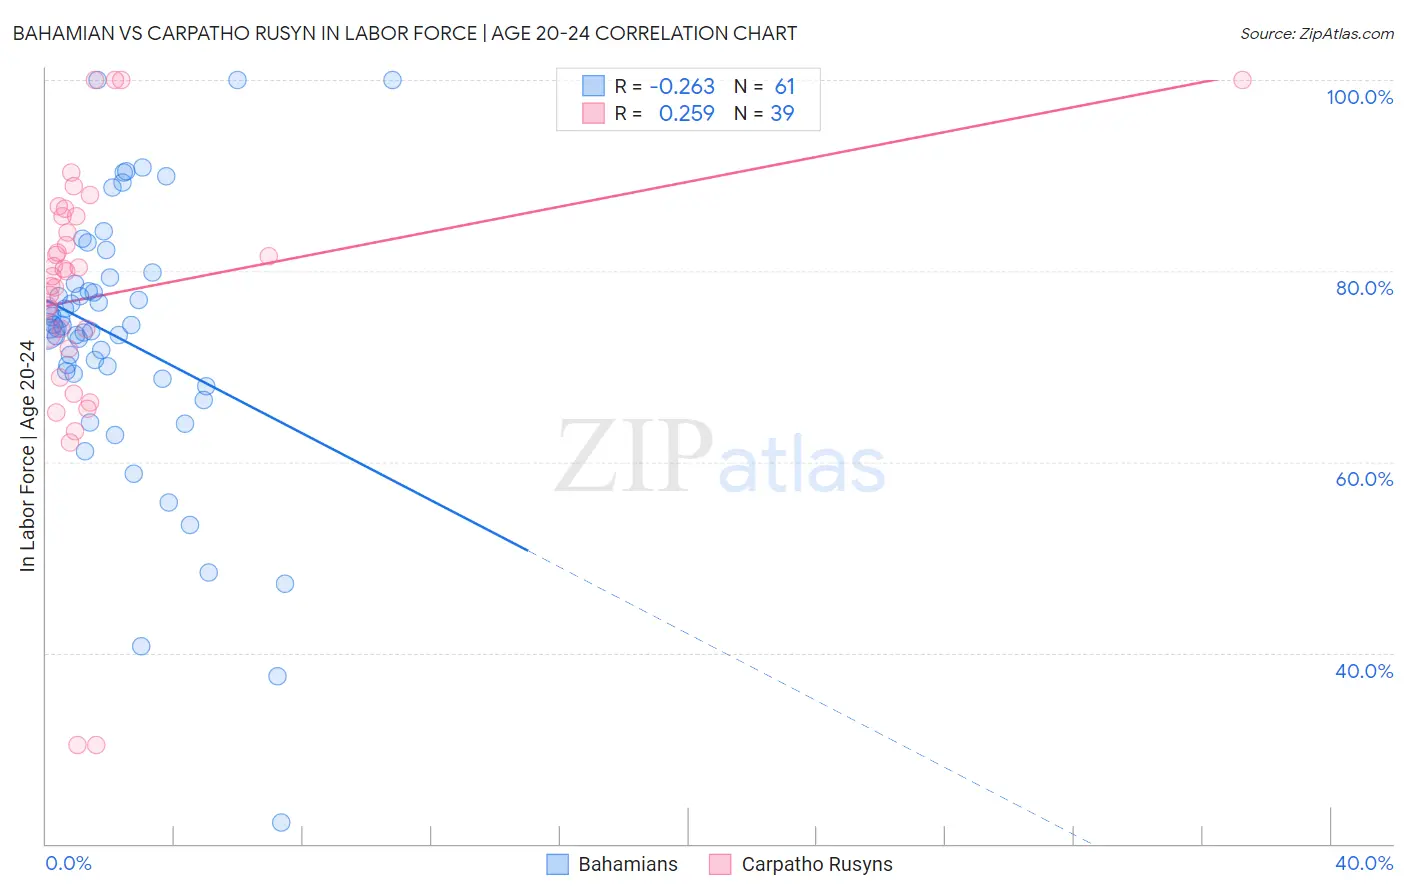
Bahamian vs Carpatho Rusyn In Labor Force | Age 20-24 Correlation Chart
The statistical analysis conducted on geographies consisting of 112,697,524 people shows a weak negative correlation between the proportion of Bahamians and labor force participation rate among population between the ages 20 and 24 in the United States with a correlation coefficient (R) of -0.263 and weighted average of 73.3%. Similarly, the statistical analysis conducted on geographies consisting of 58,856,005 people shows a weak positive correlation between the proportion of Carpatho Rusyns and labor force participation rate among population between the ages 20 and 24 in the United States with a correlation coefficient (R) of 0.259 and weighted average of 76.5%, a difference of 4.4%.
In Labor Force | Age 20-24 Correlation Summary
| Measurement | Bahamian | Carpatho Rusyn |
| Minimum | 22.2% | 30.4% |
| Maximum | 100.0% | 100.0% |
| Range | 77.8% | 69.6% |
| Mean | 72.9% | 77.5% |
| Median | 74.0% | 80.0% |
| Interquartile 25% (IQ1) | 69.0% | 71.9% |
| Interquartile 75% (IQ3) | 79.0% | 85.7% |
| Interquartile Range (IQR) | 10.0% | 13.8% |
| Standard Deviation (Sample) | 14.3% | 14.9% |
| Standard Deviation (Population) | 14.1% | 14.7% |
Similar Demographics by In Labor Force | Age 20-24
Demographics Similar to Bahamians by In Labor Force | Age 20-24
In terms of in labor force | age 20-24, the demographic groups most similar to Bahamians are Immigrants from Venezuela (73.2%, a difference of 0.030%), Immigrants from Spain (73.2%, a difference of 0.040%), Immigrants from Bahamas (73.2%, a difference of 0.050%), Venezuelan (73.3%, a difference of 0.070%), and Kiowa (73.2%, a difference of 0.070%).
| Demographics | Rating | Rank | In Labor Force | Age 20-24 |
| Cheyenne | 0.2 /100 | #273 | Tragic 73.4% |
| Immigrants | Colombia | 0.2 /100 | #274 | Tragic 73.4% |
| Immigrants | South America | 0.2 /100 | #275 | Tragic 73.3% |
| Mongolians | 0.2 /100 | #276 | Tragic 73.3% |
| Immigrants | Malaysia | 0.2 /100 | #277 | Tragic 73.3% |
| Cypriots | 0.2 /100 | #278 | Tragic 73.3% |
| Venezuelans | 0.2 /100 | #279 | Tragic 73.3% |
| Bahamians | 0.1 /100 | #280 | Tragic 73.3% |
| Immigrants | Venezuela | 0.1 /100 | #281 | Tragic 73.2% |
| Immigrants | Spain | 0.1 /100 | #282 | Tragic 73.2% |
| Immigrants | Bahamas | 0.1 /100 | #283 | Tragic 73.2% |
| Kiowa | 0.1 /100 | #284 | Tragic 73.2% |
| Nicaraguans | 0.1 /100 | #285 | Tragic 73.2% |
| Immigrants | Lebanon | 0.1 /100 | #286 | Tragic 73.1% |
| Immigrants | Korea | 0.1 /100 | #287 | Tragic 73.1% |
Demographics Similar to Carpatho Rusyns by In Labor Force | Age 20-24
In terms of in labor force | age 20-24, the demographic groups most similar to Carpatho Rusyns are Austrian (76.5%, a difference of 0.010%), Portuguese (76.4%, a difference of 0.040%), Immigrants from Iraq (76.4%, a difference of 0.060%), Immigrants from Thailand (76.4%, a difference of 0.060%), and Basque (76.5%, a difference of 0.090%).
| Demographics | Rating | Rank | In Labor Force | Age 20-24 |
| Immigrants | Moldova | 99.6 /100 | #76 | Exceptional 76.6% |
| Immigrants | Cameroon | 99.6 /100 | #77 | Exceptional 76.6% |
| Canadians | 99.6 /100 | #78 | Exceptional 76.6% |
| Immigrants | Zaire | 99.6 /100 | #79 | Exceptional 76.6% |
| Italians | 99.6 /100 | #80 | Exceptional 76.5% |
| Basques | 99.5 /100 | #81 | Exceptional 76.5% |
| Hmong | 99.5 /100 | #82 | Exceptional 76.5% |
| Carpatho Rusyns | 99.4 /100 | #83 | Exceptional 76.5% |
| Austrians | 99.4 /100 | #84 | Exceptional 76.5% |
| Portuguese | 99.3 /100 | #85 | Exceptional 76.4% |
| Immigrants | Iraq | 99.3 /100 | #86 | Exceptional 76.4% |
| Immigrants | Thailand | 99.3 /100 | #87 | Exceptional 76.4% |
| Spanish | 99.2 /100 | #88 | Exceptional 76.4% |
| Bulgarians | 99.2 /100 | #89 | Exceptional 76.4% |
| Immigrants | Burma/Myanmar | 99.1 /100 | #90 | Exceptional 76.3% |