Native Hawaiian vs Carpatho Rusyn Seniors Poverty Over the Age of 65
COMPARE
Native Hawaiian
Carpatho Rusyn
Seniors Poverty Over the Age of 65
Seniors Poverty Over the Age of 65 Comparison
Native Hawaiians
Carpatho Rusyns
9.4%
SENIORS POVERTY OVER THE AGE OF 65
99.8/ 100
METRIC RATING
33rd/ 347
METRIC RANK
9.7%
SENIORS POVERTY OVER THE AGE OF 65
99.3/ 100
METRIC RATING
51st/ 347
METRIC RANK
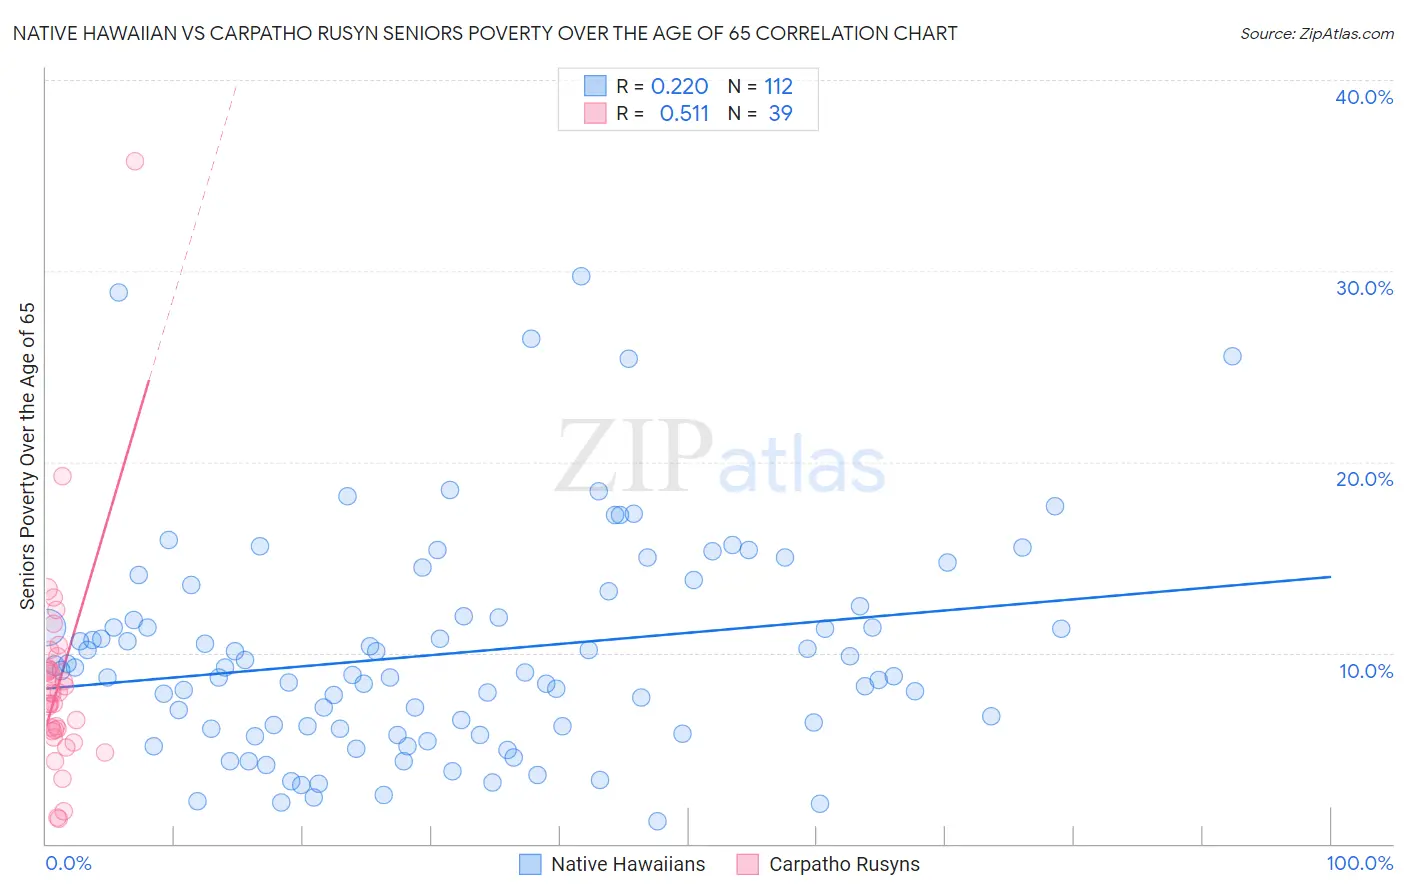
Native Hawaiian vs Carpatho Rusyn Seniors Poverty Over the Age of 65 Correlation Chart
The statistical analysis conducted on geographies consisting of 330,714,575 people shows a weak positive correlation between the proportion of Native Hawaiians and poverty level among seniors over the age of 65 in the United States with a correlation coefficient (R) of 0.220 and weighted average of 9.4%. Similarly, the statistical analysis conducted on geographies consisting of 58,841,096 people shows a substantial positive correlation between the proportion of Carpatho Rusyns and poverty level among seniors over the age of 65 in the United States with a correlation coefficient (R) of 0.511 and weighted average of 9.7%, a difference of 3.6%.
Seniors Poverty Over the Age of 65 Correlation Summary
| Measurement | Native Hawaiian | Carpatho Rusyn |
| Minimum | 1.2% | 1.3% |
| Maximum | 29.8% | 35.7% |
| Range | 28.6% | 34.4% |
| Mean | 10.0% | 8.4% |
| Median | 9.0% | 7.8% |
| Interquartile 25% (IQ1) | 6.0% | 5.9% |
| Interquartile 75% (IQ3) | 12.2% | 9.2% |
| Interquartile Range (IQR) | 6.1% | 3.3% |
| Standard Deviation (Sample) | 5.7% | 5.6% |
| Standard Deviation (Population) | 5.6% | 5.6% |
Demographics Similar to Native Hawaiians and Carpatho Rusyns by Seniors Poverty Over the Age of 65
In terms of seniors poverty over the age of 65, the demographic groups most similar to Native Hawaiians are Northern European (9.4%, a difference of 0.020%), British (9.4%, a difference of 0.10%), Latvian (9.5%, a difference of 0.48%), Czechoslovakian (9.5%, a difference of 0.53%), and Scotch-Irish (9.5%, a difference of 1.0%). Similarly, the demographic groups most similar to Carpatho Rusyns are Filipino (9.7%, a difference of 0.020%), Hungarian (9.7%, a difference of 0.48%), Immigrants from Lithuania (9.7%, a difference of 0.71%), French (9.7%, a difference of 0.77%), and Immigrants from Taiwan (9.7%, a difference of 0.88%).
| Demographics | Rating | Rank | Seniors Poverty Over the Age of 65 |
| Northern Europeans | 99.8 /100 | #32 | Exceptional 9.4% |
| Native Hawaiians | 99.8 /100 | #33 | Exceptional 9.4% |
| British | 99.8 /100 | #34 | Exceptional 9.4% |
| Latvians | 99.8 /100 | #35 | Exceptional 9.5% |
| Czechoslovakians | 99.8 /100 | #36 | Exceptional 9.5% |
| Scotch-Irish | 99.7 /100 | #37 | Exceptional 9.5% |
| Belgians | 99.7 /100 | #38 | Exceptional 9.5% |
| Greeks | 99.6 /100 | #39 | Exceptional 9.6% |
| Assyrians/Chaldeans/Syriacs | 99.6 /100 | #40 | Exceptional 9.6% |
| Immigrants | North Macedonia | 99.6 /100 | #41 | Exceptional 9.6% |
| Zimbabweans | 99.6 /100 | #42 | Exceptional 9.6% |
| Eastern Europeans | 99.6 /100 | #43 | Exceptional 9.6% |
| Austrians | 99.5 /100 | #44 | Exceptional 9.6% |
| Estonians | 99.5 /100 | #45 | Exceptional 9.6% |
| Immigrants | Taiwan | 99.5 /100 | #46 | Exceptional 9.7% |
| Immigrants | South Central Asia | 99.5 /100 | #47 | Exceptional 9.7% |
| French | 99.5 /100 | #48 | Exceptional 9.7% |
| Immigrants | Lithuania | 99.4 /100 | #49 | Exceptional 9.7% |
| Hungarians | 99.4 /100 | #50 | Exceptional 9.7% |
| Carpatho Rusyns | 99.3 /100 | #51 | Exceptional 9.7% |
| Filipinos | 99.3 /100 | #52 | Exceptional 9.7% |