Native Hawaiian vs Indonesian In Labor Force | Age 20-24
COMPARE
Native Hawaiian
Indonesian
In Labor Force | Age 20-24
In Labor Force | Age 20-24 Comparison
Native Hawaiians
Indonesians
77.4%
IN LABOR FORCE | AGE 20-24
100.0/ 100
METRIC RATING
45th/ 347
METRIC RANK
77.2%
IN LABOR FORCE | AGE 20-24
100.0/ 100
METRIC RATING
52nd/ 347
METRIC RANK
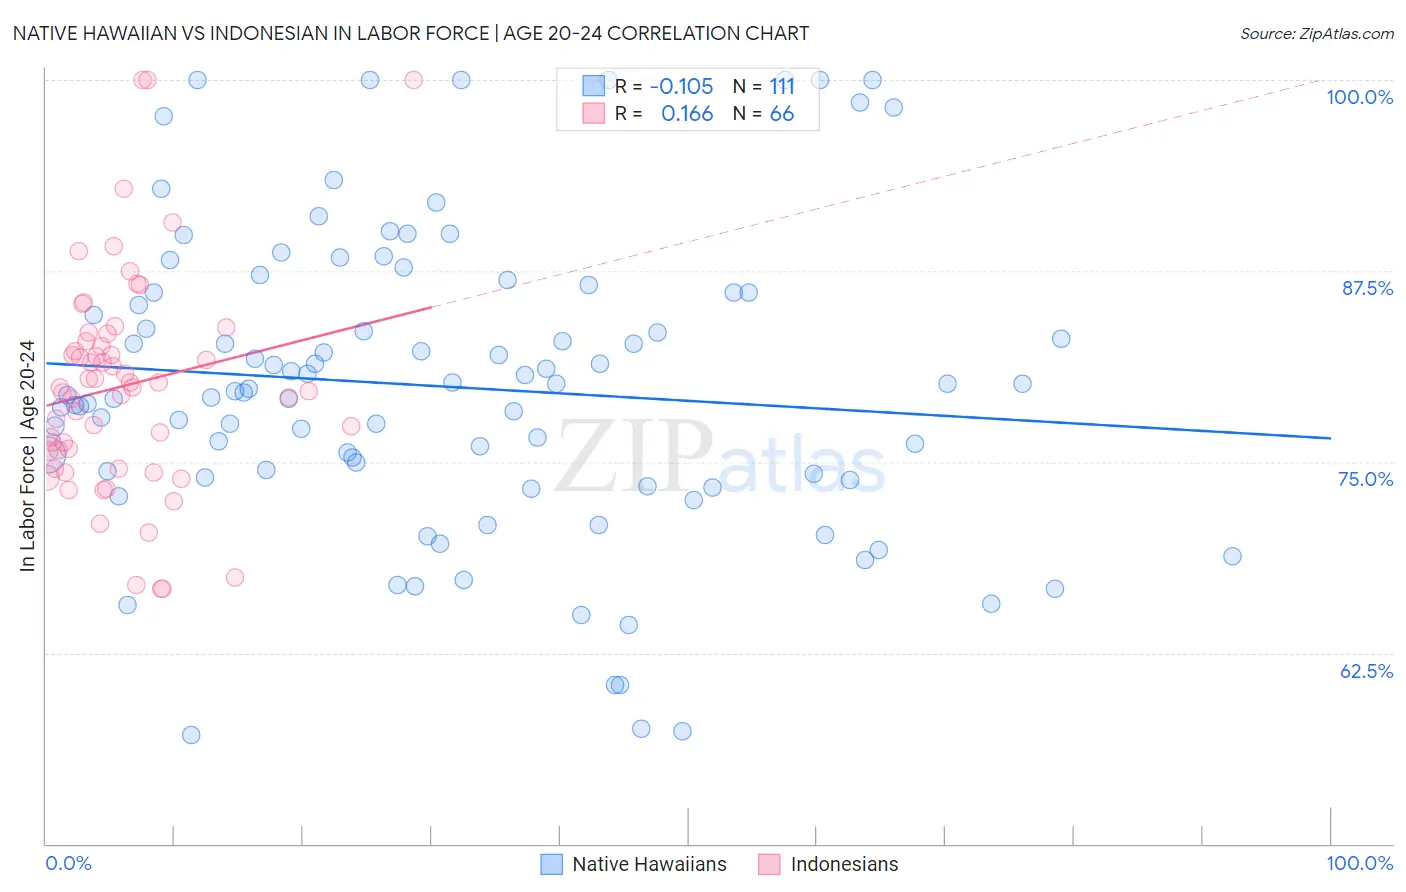
Native Hawaiian vs Indonesian In Labor Force | Age 20-24 Correlation Chart
The statistical analysis conducted on geographies consisting of 331,991,642 people shows a poor negative correlation between the proportion of Native Hawaiians and labor force participation rate among population between the ages 20 and 24 in the United States with a correlation coefficient (R) of -0.105 and weighted average of 77.4%. Similarly, the statistical analysis conducted on geographies consisting of 162,737,934 people shows a poor positive correlation between the proportion of Indonesians and labor force participation rate among population between the ages 20 and 24 in the United States with a correlation coefficient (R) of 0.166 and weighted average of 77.2%, a difference of 0.18%.
In Labor Force | Age 20-24 Correlation Summary
| Measurement | Native Hawaiian | Indonesian |
| Minimum | 57.1% | 66.7% |
| Maximum | 100.0% | 100.0% |
| Range | 42.9% | 33.3% |
| Mean | 79.9% | 80.0% |
| Median | 79.6% | 79.9% |
| Interquartile 25% (IQ1) | 74.0% | 75.7% |
| Interquartile 75% (IQ3) | 86.1% | 82.9% |
| Interquartile Range (IQR) | 12.1% | 7.2% |
| Standard Deviation (Sample) | 9.9% | 7.1% |
| Standard Deviation (Population) | 9.9% | 7.1% |
Demographics Similar to Native Hawaiians and Indonesians by In Labor Force | Age 20-24
In terms of in labor force | age 20-24, the demographic groups most similar to Native Hawaiians are Fijian (77.4%, a difference of 0.010%), Samoan (77.4%, a difference of 0.010%), Immigrants from Laos (77.4%, a difference of 0.020%), French (77.4%, a difference of 0.030%), and Immigrants from Congo (77.4%, a difference of 0.040%). Similarly, the demographic groups most similar to Indonesians are Croatian (77.2%, a difference of 0.010%), Immigrants from the Azores (77.2%, a difference of 0.010%), Malaysian (77.2%, a difference of 0.020%), Serbian (77.3%, a difference of 0.060%), and Chinese (77.3%, a difference of 0.060%).
| Demographics | Rating | Rank | In Labor Force | Age 20-24 |
| Marshallese | 100.0 /100 | #38 | Exceptional 77.4% |
| Irish | 100.0 /100 | #39 | Exceptional 77.4% |
| Scottish | 100.0 /100 | #40 | Exceptional 77.4% |
| Immigrants | Congo | 100.0 /100 | #41 | Exceptional 77.4% |
| French | 100.0 /100 | #42 | Exceptional 77.4% |
| Immigrants | Laos | 100.0 /100 | #43 | Exceptional 77.4% |
| Fijians | 100.0 /100 | #44 | Exceptional 77.4% |
| Native Hawaiians | 100.0 /100 | #45 | Exceptional 77.4% |
| Samoans | 100.0 /100 | #46 | Exceptional 77.4% |
| Ethiopians | 100.0 /100 | #47 | Exceptional 77.3% |
| Serbians | 100.0 /100 | #48 | Exceptional 77.3% |
| Chinese | 100.0 /100 | #49 | Exceptional 77.3% |
| Malaysians | 100.0 /100 | #50 | Exceptional 77.2% |
| Croatians | 100.0 /100 | #51 | Exceptional 77.2% |
| Indonesians | 100.0 /100 | #52 | Exceptional 77.2% |
| Immigrants | Azores | 100.0 /100 | #53 | Exceptional 77.2% |
| Celtics | 99.9 /100 | #54 | Exceptional 77.1% |
| Immigrants | Liberia | 99.9 /100 | #55 | Exceptional 77.1% |
| Europeans | 99.9 /100 | #56 | Exceptional 77.1% |
| Chippewa | 99.9 /100 | #57 | Exceptional 77.1% |
| Hawaiians | 99.9 /100 | #58 | Exceptional 77.0% |