Native Hawaiian vs Inupiat In Labor Force | Age 20-24
COMPARE
Native Hawaiian
Inupiat
In Labor Force | Age 20-24
In Labor Force | Age 20-24 Comparison
Native Hawaiians
Inupiat
77.4%
IN LABOR FORCE | AGE 20-24
100.0/ 100
METRIC RATING
45th/ 347
METRIC RANK
74.6%
IN LABOR FORCE | AGE 20-24
17.6/ 100
METRIC RATING
205th/ 347
METRIC RANK
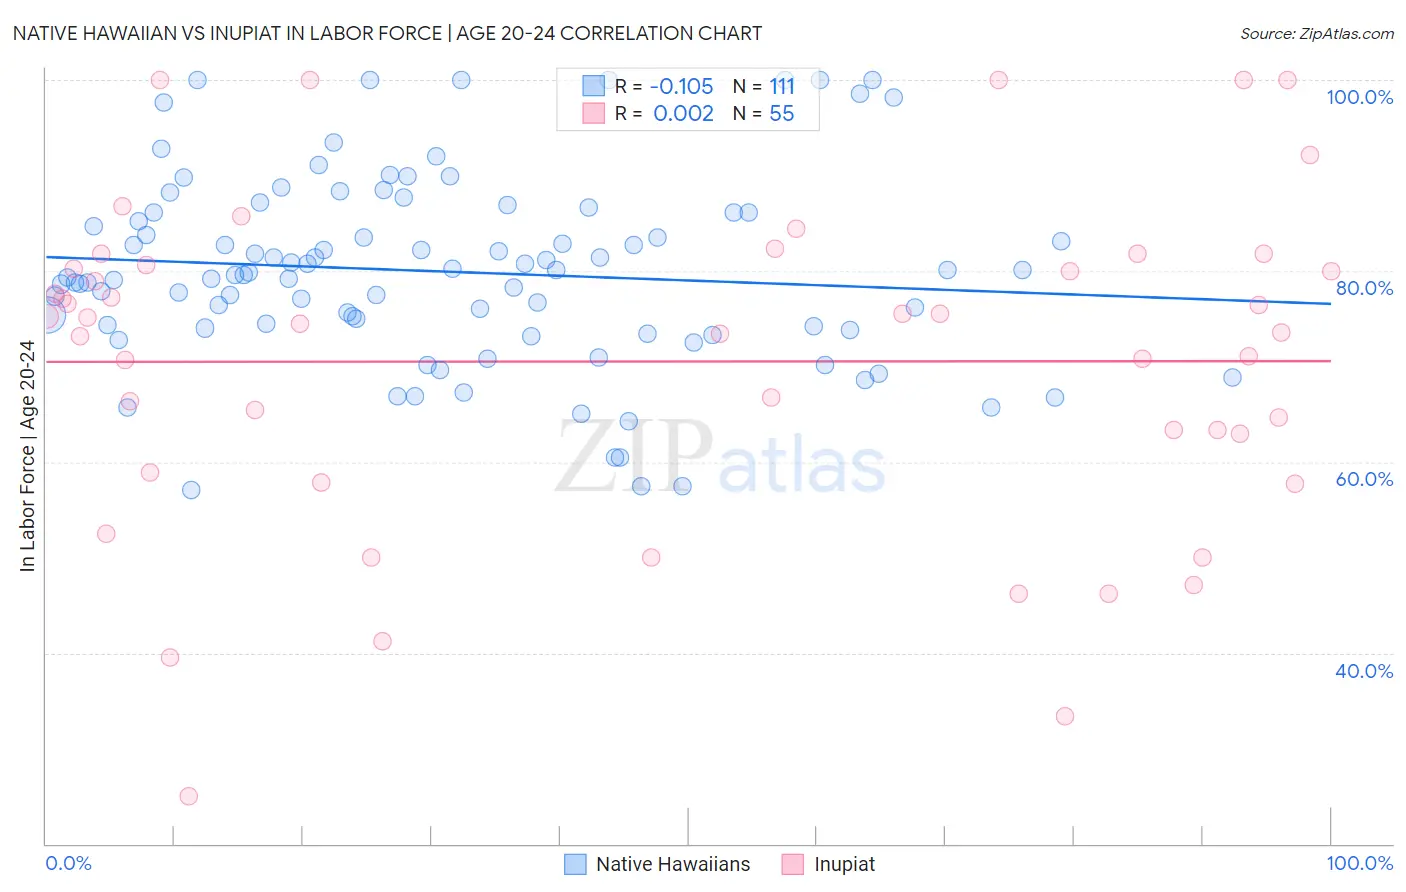
Native Hawaiian vs Inupiat In Labor Force | Age 20-24 Correlation Chart
The statistical analysis conducted on geographies consisting of 331,991,642 people shows a poor negative correlation between the proportion of Native Hawaiians and labor force participation rate among population between the ages 20 and 24 in the United States with a correlation coefficient (R) of -0.105 and weighted average of 77.4%. Similarly, the statistical analysis conducted on geographies consisting of 96,340,626 people shows no correlation between the proportion of Inupiat and labor force participation rate among population between the ages 20 and 24 in the United States with a correlation coefficient (R) of 0.002 and weighted average of 74.6%, a difference of 3.7%.
In Labor Force | Age 20-24 Correlation Summary
| Measurement | Native Hawaiian | Inupiat |
| Minimum | 57.1% | 25.0% |
| Maximum | 100.0% | 100.0% |
| Range | 42.9% | 75.0% |
| Mean | 79.9% | 70.5% |
| Median | 79.6% | 74.5% |
| Interquartile 25% (IQ1) | 74.0% | 58.9% |
| Interquartile 75% (IQ3) | 86.1% | 80.6% |
| Interquartile Range (IQR) | 12.1% | 21.7% |
| Standard Deviation (Sample) | 9.9% | 17.3% |
| Standard Deviation (Population) | 9.9% | 17.1% |
Similar Demographics by In Labor Force | Age 20-24
Demographics Similar to Native Hawaiians by In Labor Force | Age 20-24
In terms of in labor force | age 20-24, the demographic groups most similar to Native Hawaiians are Fijian (77.4%, a difference of 0.010%), Samoan (77.4%, a difference of 0.010%), Immigrants from Laos (77.4%, a difference of 0.020%), French (77.4%, a difference of 0.030%), and Immigrants from Congo (77.4%, a difference of 0.040%).
| Demographics | Rating | Rank | In Labor Force | Age 20-24 |
| Marshallese | 100.0 /100 | #38 | Exceptional 77.4% |
| Irish | 100.0 /100 | #39 | Exceptional 77.4% |
| Scottish | 100.0 /100 | #40 | Exceptional 77.4% |
| Immigrants | Congo | 100.0 /100 | #41 | Exceptional 77.4% |
| French | 100.0 /100 | #42 | Exceptional 77.4% |
| Immigrants | Laos | 100.0 /100 | #43 | Exceptional 77.4% |
| Fijians | 100.0 /100 | #44 | Exceptional 77.4% |
| Native Hawaiians | 100.0 /100 | #45 | Exceptional 77.4% |
| Samoans | 100.0 /100 | #46 | Exceptional 77.4% |
| Ethiopians | 100.0 /100 | #47 | Exceptional 77.3% |
| Serbians | 100.0 /100 | #48 | Exceptional 77.3% |
| Chinese | 100.0 /100 | #49 | Exceptional 77.3% |
| Malaysians | 100.0 /100 | #50 | Exceptional 77.2% |
| Croatians | 100.0 /100 | #51 | Exceptional 77.2% |
| Indonesians | 100.0 /100 | #52 | Exceptional 77.2% |
Demographics Similar to Inupiat by In Labor Force | Age 20-24
In terms of in labor force | age 20-24, the demographic groups most similar to Inupiat are Immigrants from Italy (74.6%, a difference of 0.0%), Sioux (74.6%, a difference of 0.0%), Immigrants from Northern Africa (74.6%, a difference of 0.010%), Albanian (74.6%, a difference of 0.040%), and Immigrants from Uruguay (74.6%, a difference of 0.050%).
| Demographics | Rating | Rank | In Labor Force | Age 20-24 |
| Immigrants | Nigeria | 24.2 /100 | #198 | Fair 74.7% |
| Taiwanese | 23.2 /100 | #199 | Fair 74.7% |
| Nigerians | 21.9 /100 | #200 | Fair 74.7% |
| Choctaw | 21.4 /100 | #201 | Fair 74.7% |
| Moroccans | 20.4 /100 | #202 | Fair 74.7% |
| Immigrants | Northern Africa | 17.9 /100 | #203 | Poor 74.6% |
| Immigrants | Italy | 17.6 /100 | #204 | Poor 74.6% |
| Inupiat | 17.6 /100 | #205 | Poor 74.6% |
| Sioux | 17.5 /100 | #206 | Poor 74.6% |
| Albanians | 16.2 /100 | #207 | Poor 74.6% |
| Immigrants | Uruguay | 15.8 /100 | #208 | Poor 74.6% |
| Arabs | 15.8 /100 | #209 | Poor 74.6% |
| Uruguayans | 15.1 /100 | #210 | Poor 74.6% |
| Immigrants | Australia | 14.7 /100 | #211 | Poor 74.6% |
| Creek | 13.3 /100 | #212 | Poor 74.5% |